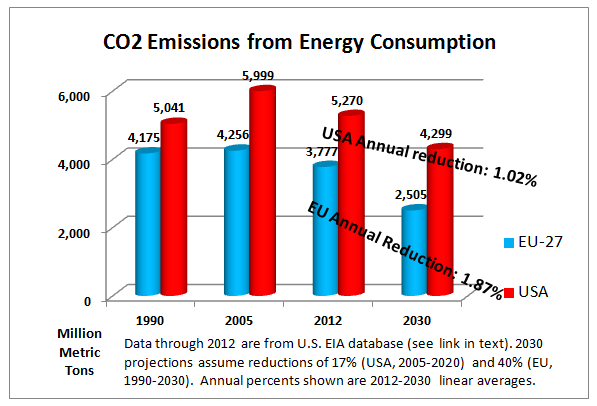
The European Union announced last week its intention to reduce emissions of greenhouse gases by 40% from 1990 levels by 2030. Meanwhile, the U.S. goal remains a 17% emissions cut from 2005 levels, by 2020.
Two different percentages over two different time periods. How do the EU and U.S. trajectories compare? Is the EU’s use of a 1990 baseline cheapening its goal, as some have suggested?
No, it turns out. As the graphic shows, the 27 countries making up the European Union generated slightly less CO2 in the EU’s baseline year of 1990 than in the 2005 baseline chosen by United States authorities. More importantly, after running a few numbers, we can safely report that the EU emissions objective embodies nearly twice as high a reduction rate to 2030 from 2012 (the most recent year with comparable data) as the US target: an average annual decline in emissions of 1.87% for the EU, vs. 1.02% for the United States.
To be sure, both 2030 figures are targets, nothing more. (Because the U.S. has not established a 2030 target, we extended to 2030 the annual U.S. 2005-2020 reduction rate implied by the objective of cutting emissions by 17%. Note also that all figures are carbon dioxide emissions from energy consumption only, i.e., CO2 from forestation changes or cement manufacture are excluded, as are emissions of methane and other greenhouse gases. All historical data are from a terrific on-line database compiled by the U.S. Energy Information Administration, which shows CO2 emissions for virtually every country and major region each year from 1990 through 2012.)
As for getting to those targets: The current U.S. strategy relies primarily on two elements: the EPA Clean Power Plan to cut electricity-sector emissions 30% from the 2005 level, and mandated increases in automobile fleet economy of around 60% for 2025 new vehicles vs. 2012 (though much less for bigger light trucks). While there is no single EU strategy, most if not all European eyes are on Germany, whose Energiewende (energy transition) is rapidly making over the physical and energy landscape of Europe’s powerhouse economy.
How big a carbon tax would enable the U.S. to meet its 2030 target? Assuming a linear ramp-up with annual increases equal to the starting tax rate, a national tax starting in 2015 at $5.35 per (short) ton of CO2 and rising by $5.35/ton each year would do the job, according to CTC’s carbon tax spreadsheet model. Alternatively, to accelerate the reductions to match the EU’s target trajectory, the starting and rising per-ton rates would need to be around $11.20 — coincidentally a tad less than the $11.34 per short ton (or $12.50 per metric ton) starting and annual rampup rates embodied in the McDermott Managed Carbon Price Act of 2014, and not much more than the $10 rates in Rep. John Larson’s America’s Energy Security Trust Fund Act of 2014.
Finally, consider the hassles of comparing different percentage reductions from different baseline as yet another reason to move policy discussions toward a structure that reinforces rising national carbon prices — calibrated to meet global climate stabilization goals. That’s what we hope the United Nations Climate Change Conference (COP 21) will do late next year in Paris as the Kyoto Accords finally expire.


Robert says
Very useful. Thank you.
Wondering if you can let us know whether or not the EU estimates of reductions include methane emissions or the other heat-trapping sources left out of US estimates?
Thanks,
Dr Tod Policandriotes says
There are new technologies to reduce carbon output in making C/C composites, but companies currently producing using old technologies are very resistant in investing in technologies to replace the old methods. Part of the carbon tax should go to funding the development and the incorporation of these new technologies into current industries requiring these upgrades.
Sieren says
Hi Charlie,
Thanks for this excellent post and useful graphic. Quick question–do the EU emission reductions consider the impact of the carry-forward from the ETS surplus, which are currently over 2 billion tons, and could be as high as 4 billion by 2020? Could be useful to see this comparison.
Kind regards,
Sieren