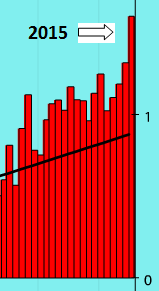
Even for folks hardened by decades in the trenches fighting climate change, the release yesterday of 2015 planetary temperature data was still shocking. The “global land and water temperature” didn’t just set another record last year, it changed the rate at which those records are being set.
This morning we downloaded the official NOAA/NCDC global temperature dataset of temperature anomalies — that’s each year’s deviation from the trend increase averaged across the 20th Century. Here’s what we saw when we ran the stats:
- The 2015 anomaly was 0.90 degrees Celsius (1.6 degrees Fahrenheit; except for graph excerpt at right, all figures here are Celsius); in other words, last year’s global average temperature was almost a full degree above the 20th Century average.
- The 2015 temperature anomaly was 0.16 degrees greater than the anomaly for 2014, making last year’s increase the biggest since 1997 — even though the 2014 anomaly had just set a new record.
- The trendline we drew through 1975-2015 temperature data has a nearly 4 percent steeper slope than our year-earlier trendline for 1975-2014 data. Adding 2015 data in effect lifts the prior trend from its moorings, like an earthquake, tilting it upward.
Here’s how climate scientist Michael Mann characterized the new data, as reported by the New York Times:
Michael E. Mann, a climate scientist at Pennsylvania State University, calculated that if the global climate were not warming, the odds of setting two back-to-back record years would be remote, about one chance in every 1,500 pairs of years. Given the reality that the planet is warming, the odds become far higher, about one chance in 10, according to Dr. Mann’s calculations.
(The entire Times article, which led the paper’s Jan. 21 print edition and was written by the paper’s superb climate reporter, Justin Gillis, is well worth reading.)
Here’s one more way of grasping how the rate of temperature rise is accelerating:
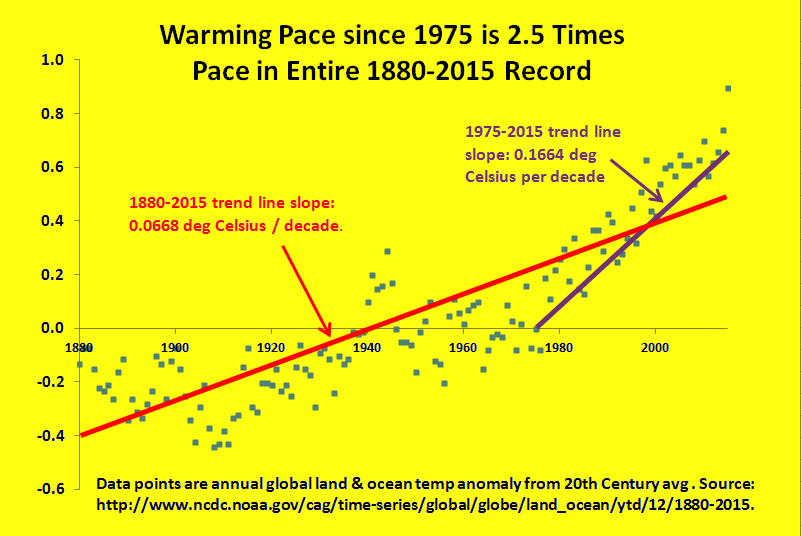
The trendline running through the entire 1880-2015 NOAA/NCDC dataset yields an average rate of temperature rise of 0.0668 degrees per decade; it’s probably easier to multiply that by 10 to derive a per-century rise of two-thirds of one degree. However, a trendline on just the most recent 40 years, 1975-2015, gives an average rise of 0.1664 degrees per decade, or one-and-two-thirds of one degree per century. Over the past 40 years, temperatures have risen 2.5 times as fast as they have over the entire 135-year record.
(NB: Our 1880-2015 slope matches the slope reported by NOAA/NCDC. Our choice of 1975 as the start year for our recent trendline has no particular significance; a regression on 1995-2015 yields a similar slope. For those interested in methodological issues in temperature measuring, the Niskanen Institute posted a useful primer earlier this week.)
In his State of the Union Address last week, President Obama sent a message to senators and representatives on the GOP side of the aisle:
[I]f anybody still wants to dispute the science around climate change, have at it. You will be pretty lonely, because you’ll be debating our military, most of America’s business leaders, the majority of the American people, almost the entire scientific community, and 200 nations around the world who agree it’s a problem and intend to solve it.
It’s hard to discern the extent to which the denialism running through the Republican Party is driven by ideology or by politics, especially since the two are strongly intertwined. At some point, reality will come into play. Temperature data can help that happen. So can election returns.


