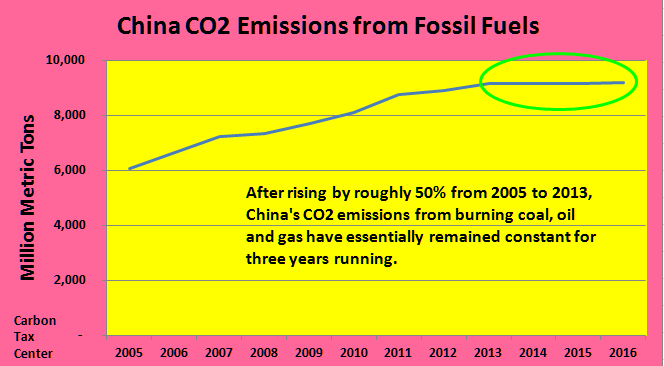
On the eve of China president Xi Jinping’s scheduled two-day visit with the U.S. president, we took a deep dive into data on China’s energy use and carbon emissions. With the help of Fordham University student (and CTC intern) Cristina Mendez, who drew on official Chinese government statistics along with outside sources including Carbon Brief, we find that China has essentially capped its carbon pollution emissions — far ahead of the 2030 date for capping CO2 to which China committed in the landmark 2014 agreement between President Xi and then-U.S. President Obama.

If three years make a trend, China is a decade-and-a-half ahead of schedule in capping its carbon emissions.
That agreement followed a year-long diplomatic offensive initiated by then-U.S. Secretary of State John Kerry, and effectively ended the “axis of denial” by which China and the United States, by far the world’s largest climate polluters, pointed to the other’s inaction to justify its own. The bilateral accord in turn paved the way for the December 2015 Paris climate agreement in which nearly 200 nations pledged to rein in their emissions of carbon dioxide and other climate-destroying greenhouse gases.
A naysayer could point out the divergence between U.S. and China carbon emissions since 2005 (a standard “baseline” year for comparisons over time). In that year, U.S. emissions of CO2 from burning coal, oil and gas were around 5,810 million metric tons (“tonnes”), just a shade below China’s estimated 6,160 million tonnes in the same year. Since then, U.S. emissions have fallen by around 800 million tonnes while CO2 from fossil fuel burning in China grew by over 3,000 million tonnes.
That’s a swing of nearly 4 billion tonnes between the changes in the two countries’ emissions, a huge difference that can’t be swept under the rug. Nonetheless, it is tempered by four key considerations.
1. China’s carbon emissions, though now nearly twice those of the United States, are well under half of U.S. emissions on a per capita basis. With almost 1.4 billion people, The population of China is more than four times the U.S. population of 325 million. U.S. per capita CO2 emissions, which we estimate at 15.4 metric tons last year, are nearly two-and-a-half times as great as China’s 6.4 tonnes per person.
2. A considerable part of China’s CO2 comes from electricity and direct fuel burning to manufacture goods exported to the United States. Those emissions far outstrip U.S. emissions to supply agricultural and other products to China.
3. Based on historical CO2 emissions — which determine the amount of atmospheric carbon pollution now trapping Earth’s heat, given the roughly hundred-year time scale for a carbon dioxide molecule to distintegrate — U.S. climate-damage responsibility is roughly double China’s, even without normalizing for population. (For that calculation we added the past dozen years of respective emissions to the World Resources Institute’s compilation of the world’s nations cumulative carbon emissions during 1900-2004.)

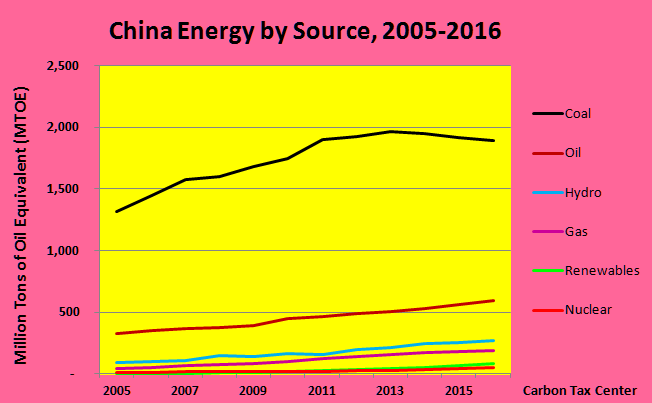
Coal’s dominance in China energy is weakening, albeit slowly.
4. Most importantly, if we wish to look forward: The apparent capping of China’s CO2 emissions over the past three years marks a sea-change in that country’s previously inexorable rise in carbon pollution over the prior several decades. It was only in 1988 that China’s CO2 emissions from fossil fuels (along with cement manufacture, which is otherwise excluded from the data in this post) passed 2 billion metric tons, based on a terrific WRI times-series visualization. The implied annual growth rate to 2013, when the total (without cement) surpassed 9 billion, was greater than 6 percent per year. From 2005 to 2013, China’s compound average emissions increase rate was 5.3 percent. To bring emissions to a screeching halt since then, without war, famine or other cataclysm, is close to miraculous.
Two charts tell the story. The first, directly above, shows the overwhelming dominance of coal in China’s energy supply, but moderating since 2011 and falling since 2013. This is significant because coal is the most carbon-intensive fossil fuel, not to mention the most polluting in terms of “conventional” pollutants such as sulfur dioxide and fine particulates that kill several million Chinese people each year and sicken hundreds of millions more, as the New York Times has reported on multiple occasions. (See, for example, here, here and, perhaps most damningly, here.)
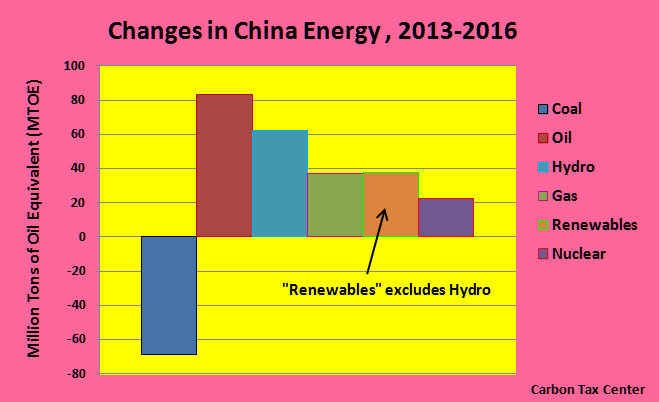
The second graph, below, highlights the changes in that supply over the past three years. Coal is down, while all other energy sources are up. In carbon terms (not shown in the graph), the combined increase in oil and gas use slightly more than offset the decline in coal burning, thus statistically creating a minuscule net estimated increase in CO2 of four-tenths of one percent from 2013 to 2016. Perhaps more importantly, energy output from carbon-free hydro-electric dams, non-hydro renewables (chiefly wind turbines and solar-photovoltaics) and nuclear power all increased, with their combined gain easily exceeding the net expansion in fossil fuel use.

Other fuels and technologies are finally starting to push down coal use in China.
The United States is not without its own climate triumph; as we pointed out in our recent “Good News” blog post and report, U.S. electricity-sector emissions (from power plants burning fossil fuels) fell 25 percent from 2005 to 2016 — a reduction equalling nearly four-fifths of the Clean Power Plan’s intended 32 percent drop in power-sector emissions from 2005 to 2030. (Note that our 25 percent figure is down slightly from the 27 percent reduction we reported in December, with preliminary 2016 data; both the post and report have been updated to reflect full-year emissions.)
But that’s electricity only — the “low-hanging fruit” for the U.S. and most other countries. U.S. emissions from transportation are up, as we’ll report shortly in a separate post. Far more worrisome, of course, is the Trump administration’s neanderthal assault not just on climate-related standards, regulations and research but on the very notion of energy efficiency and environmental stewardship.
The point of this data exercise is to underscore China’s historic achievement in flattening its carbon emissions. It may be premature to crown China as the new global leader in climate action, as some commentators have proposed lately. Let’s not forget that it was Germany’s pump-priming for renewable energy a decade or more ago that propelled the Chinese solar-PV industry down the cost curve. And lately the United Kingdom has been driving down carbon emissions at a remarkable rate.
But turning the corner on carbon emissions, as China apparently has done while providing material prosperity for well over a billion people, is no mean feat. The U.S. president will likely remain oblivious, but other Americans can acknowledge and celebrate China’s achievement.
Energy data for 2005-2015 are from BP, Statistical Review of World Energy, 2016, June 2016. We calculated 2016 energy data by applying year-on-year percentage changes in China Energy Portal, 2016 detailed electricity statistics, Jan. 20, 2017, and National Bureau of Statistics of China, Statistical Communiqué of People’s Republic Of China on the 2016 National Economic And Social Development, Feb. 28, 2017, Section XII. Resources, Environment and Work Safety, both accessed April 5, 2017. For coal, we applied the estimated 1.3% drop to 2016 in coal consumption stated in Jan Ivar Korsbakken & Glen Peters, A closer look at China’s stalled carbon emissions, March 1, 2017, posted to Carbon Brief, rather than the 4.7% drop asserted in NBS-China’s Statistical Communiqué. Emissions data are from BP Statistical Review (2005-2015), with 2016 calculated from the 0.3% rise to 2016 (excluding cement) estimated in Korsbakken & Peters.

Loomy says
Certainly, this is great news and other countries reductions in CO2 Emissions (especially the U.K) give cause for optimism that some of us are heading in the right direction to alleviate the more harmful effects envisaged of Global Warming by the actions taken and results needed by mid century to ensure they do not happen.
Unfortunately, the U.S remains the main cause and driver of Global Warming by its new policies, current CO2 emission per capita as well as its historical total carbon emissions accumulated in the atmosphere these last 100 years.
Unless the U.S recognises its responsibility and starts to act towards reducing its carbon/methane footprint, little can be achieved and reduced to improve the future for those descendants who will have to deal with the profit and greed focussed outcome they will find themselves in due to the selfishness of one Country far and above any other.