Five years ago, novelist and technologist Ramez Naam published a series of articles, collectively titled How Far Can Renewables Go? Pretty Darn Far, in which he wove empirical data into declining-cost curves for wind power, solar photovoltaic cells and battery storage that pointed, in his estimation, to prodigious future growth paths for renewables in the U.S.
Now, in a new post, Solar’s Future Is Insanely Cheap, Raam carries optimism about solar photovoltaics to a new height.
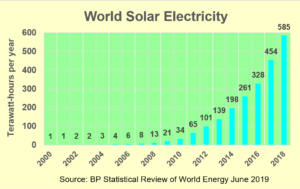
A classic early-stage growth curve: year-on-year increments increase, but year-on-year percent changes decrease.
He demonstrates that costs of utility scale solar electricity in the U.S., China, India and the world as a whole have dropped by a factor of five since 2010, putting them at around $50 per megawatt-hour (5 cents per kWh), the low end of the cost range for new fossil-fuel generating plants. He points out that most forecasts, including his own, have underestimated the speed of decline in solar costs.
Predictions
This 10-year record of plummeting solar PV costs is impressive and heartening. But what can it tell us about the next 10 or more years? To predict the cost of solar electricity going forward, Naam uses a “learning curve” approach based on Wright’s Law, a staple of industrial engineering that states that, for many technologies, each doubling of cumulative production leads to a constant percentage decline in the cost of that technology. (The decline rate varies across technologies but tends to be constant for each.)
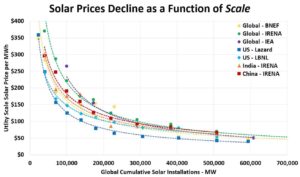
By Naam’s account, Wright’s Law has been found to apply to at least sixty technologies. Naam demonstrates it via falling prices for Henry Ford’s Model T as its production grew steadily through the period 1909 to 1923. He then compares the cost of utility-scale electricity with global cumulative installed capacity of solar, and, just as Wright’s Law would predict, finds a smooth and steady decline, which he depicts in the chart at right, below.
By plotting these data on a log/log scale (not shown here), as befits “power laws” like Wright’s Law, Naam finds that the cost of utility-scale solar generating facilities has dropped by 30% to 40% for each doubling of installed capacity. This coefficient is at the high end of “doubling elasticties” in those sixty or so technologies that are said to conform to Wright’s Law.
If ever there was cause for optimism that solar power (and perhaps its renewable-power cousin, wind turbines) can keep getting cheaper at a fast enough rate to permit and justify massive deployment (which in turn will keep driving down costs), it is Raam’s May 2020 post. Think of it: just two more doublings in cumulative production (and installed capacity) will drive down costs by another one-half to two-thirds. Affordable, irresistible solar is coming to save us from fossil fuels and climate change.
There’s a problem with this approach, however. The solar costs that Naam has plotted are total installed costs. Thus, they include not only the cost of the solar panels (modules) but the costs of inverters, trackers, cabling, mounting systems, land and labor, not to mention the business relationships and contractual arrangements necessary to actually bring each job to fruition. These so-called balance of system (BoS) costs currently account for 2/3 of the cost of solar installations, by Naam’s admission. And while it is true that the “inertia” in BoS costs means that the costs of the modules themselves have fallen even faster since 2010 than the 80 percent overall drop in solar costs in that time (that’s the 5-fold drop we noted earlier), this same inertia seems almost certain to drag down the rate of cost decline going forward.
And in fact since 2010, costs of modules have dropped approximately 10-fold; twice as much as solar installations as a whole, which means that the other parts of solar costs fell less impressively (see this and this). The slower learning rate for BoS solar costs suggests that while the modules, with their very high learning rate, might theoretically cost next to nothing, the inertia in at least some BoS costs could mean that, no matter how many megawatts and gigawatts of solar are installed here and globally, the full cost of solar electricity may level off and be unable to fall below a certain level.
Even if we assume as Naam does that a 30% to 40% learning rate applies more or less uniformly to all solar costs, including modules and BoS items, cumulative installed capacity will have to double to achieve each approximate 35% drop in cost. Successive doublings in generating capacity require larger and larger absolute increases. World solar generating capacity was about 1 gigawatt in 2000. It was over twice that in 2003, and twice that, about 4 gigawatts, in 2005. Today world solar generating capacity is about 600 gigawatts. Growing from 600 to 1200 gigawatts, and then again from 1200 to 2400 gigawatts, requires vastly more production of panels and other necessary materials than growing from 1 to 2 gigawatts and then from 2 to 4 gigawatts, etc.
In order for cumulative installed solar capacity to double and then double again by 2030, for example, solar’s rate of growth would have to maintain exponential growth in the range of 15% per year. Whether such a continued high rate of growth is at all feasible is a fair question.
Learning from History: Autos, Railroads, Electricity
U.S. solar growth has slowed of late, taking three years for its most recent doubling, from 2016 to 2019, which Naam refreshingly acknowledges, noting that “solar growth has very clearly slowed over the past few years.” This slowdown in solar’s growth in the face of continued dramatic declines in costs signals that other factors are involved than cost alone.
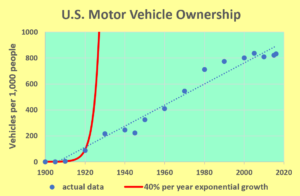
In short, cost declines following Wright’s law may not translate directly to increased deployment. Take Naam’s example of the Model T. U.S. motor vehicle ownership grew exponentially from around 1900 to 1920 but then settled into a long period or more of less linear growth, as indicated in the chart above. (In this figure and the two following it, exponential growth rates were selected that produce curves that approximately match actual data for the early years.)
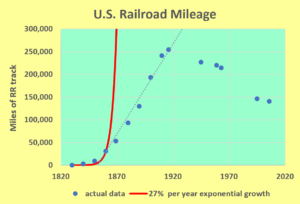
Chart by author from data in “Train Factory” exhibit and sources noted therein, Franklin Institute, Phila. PA, 2016.
Another example, shown at left, is U.S. railroad track mileage, which surged in the 1850s and 60s and then also settled into a long period of linear growth.
A third example, shown further below, is U.S. electricity generation. An exponential growth rate of about 9% per year is apparent from 1900 until the mid-1950s. Exponential growth slowed around then, and by 1970 growth had settled into a more-or-less linear pattern.
Few technologies — or natural systems, for that matter — grow in an exponential manner for long (Smil, 2014, Kramer & Haigh, 2009.) Instead, “growth curves” are characterized by an early exponential period that transitions to a linear phase, adding a more-or-less constant increment each period, which eventually levels off as constraints increasingly come into play and limit further growth.
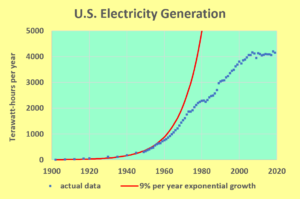
Chart by author from data in “Energy” tab of Carbon Tax Center carbon-tax spreadsheet, accessed June 6, 2020.
Growth in both motor vehicle ownership and railroad track mileage became linear despite ongoing innovations in the technologies themselves and improvements in manufacturing methods as production continued to increase. A similar pattern is apparent with U.S. electricity generation; growth gradually transitioned from exponential to linear during the ‘60s and ‘70s, as decades of declining costs (which enabled utilities to discount rates for big users) ground to a halt. Since 2005 growth in electricity use has ceased altogether, primarily due to large-scale dissemination of energy efficiency (see reference to Komanoff analysis, below).
How fast will solar electricity production grow?
Naam’s discussion of solar electricity’s declining costs is important because it can shed light on how far and fast solar electricity generation is likely to grow. In particular, can solar output grow rapidly enough to displace enough coal and natural gas to help avert climate catastrophe?
To be sure, growth in solar electricity is already pushing out fossil fuel use in the United States and other countries. In the U.S., the roughly 100 TWh increase in solar electricity production since 2005 was great enough to avert burning coal and gas that would have emitted 74 million metric tons of carbon dioxide in 2019, according to an analysis released last month by Carbon Tax Center director Charles Komanoff.
Yet that accomplishment pales beside the 1,618 million metric tons actually emitted by U.S. power plants last year. And the need for large-scale electrification of transport and heating — in order to displace petroleum — only magnifies the growth required of solar (and wind), and perhaps from other advanced energy sources such as next-generation nuclear and enhanced geothermal, to fully decarbonize the economy.-
Unfortunately, Naam doesn’t venture to predict the pace of solar growth, either for the U.S. alone or for the world as a whole. That is probably wise, seeing as that at this point, and probably for some time to come, there is no way to divine whether to extrapolate past growth figures linearly or exponentially. We’ll revisit this issue in a follow-on post scheduled for the first week of July.

Joe Sauer says
Nice! Very pro science-based, and wise words on the fallacy of extrapolating too much. A very apropos subject for the public right now, who is learning about the math of exponential growth as related to the virus that did, soon enough, morph into linear growth. A lot of early alarmist talk took the exponential growth rates at bit on the extreme (2.2mm Americans dead by the end of 2020). Though, admittedly, linear growth has proved bad enough indeed. … Regards!