[Note: A Feb. 23 update to this post with full-year 2020 vs. 2019 data for all eight world sectors revised, downward, the shrinkage of U.S. ground transport carbon emissions that we had highlighted here. That revision is substantial.]
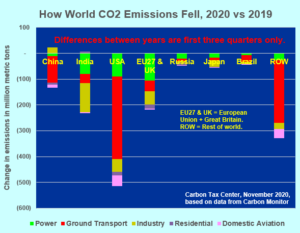
The world’s emissions of carbon dioxide from burning fossil fuels diminished by more than 1.6 billion metric tons in the first three quarters of 2020 from the same period in 2019, a decline of 6.3 percent. Fully one-fifth of the decline, 320 million tonnes, was due to the nearly 25 percent drop in ground transport in the United States, according to data compiled and made available this week by Carbon Monitor, an international collaboration of energy and climate specialists providing regularly updated, rigorous estimates of daily CO2 emissions.
 The Carbon Monitor data, downloaded and reshuffled by Carbon Tax Center, reveal the sources and extent of the drop of emissions during the COVID-19 pandemic. In both absolute and percentage terms, the total U.S. year-on-year January-September decline — 514 million metric tons and 13.1 percent — outpaced the world’s other major emitting nations and regions. The percentage drop of 13.1 percent through September more or less guarantees that U.S. carbon emissions for all of 2020 will fall below year-2019 emissions by double digits.
Close behind the United States in percentage terms of decline were Brazil, with a 12.9 percent drop from 2019 to 2020, and India with 11.7 percent. But because U.S. emissions are so large in absolute terms, the tonnage drop here dwarfed that of India (225 million tonnes) and Brazil (44 million tonnes).
China was far down the ranks of emission reducers. From the first three quarters of 2019 to the same period in 2020, its emissions shrank by just 109 million tonnes, a decline of only 1.4 percent. Although China’s ground transport carbon emissions did fall by 15 percent — just short of the rest of the world’s 16 percent decline for that category — none of the country’s other major emitting sectors showed pronounced declines, except for domestic aviation, which fell by 26 percent. Omitting China from the calculations, world CO2 emissions fell by 8.4 percent over the three-quarter periods, though admittedly that construct is a bit like considering recent U.S. presidential popular votes without California.
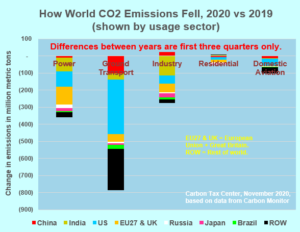
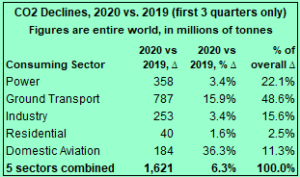
Nearly half of the global CO2 decline — 787 million tonnes out of the overall 1,621 million tonne drop — was accounted for by reduced ground transport emissions. With truck traffic probably little affected by the pandemic, as indicated by the mere 3.4 percent drop in world carbon emissions from industry, the decline presumably is attributable to decreased use of passenger vehicles. The reduction in aviation emissions was even more pronounced, at 36 percent, as many air travelers deemed it unwise to spend hours in confined aircraft spaces, and teleconferencing filled in for most business travel. The reduction rate might have been higher still, but for “ghost flights” resulting from byzantine government regulations and financial incentives.
There’s something satisfying in seeing year-on-year carbon emission figures in negative-land, even as we can’t deny the enormous human and social suffering that not only accompanied but to an extent delivered the reductions. A global pandemic causing over 1.3 million deaths and rising, according to the count maintained by Johns Hopkins University, and stunting child development as “remote learning” replaces in-person schooling, to name but one societal forfeiture, is not the path anyone would choose to curb climate-wrecking use of fossil fuels.
Perhaps we could look to the European Union, which pulled off a nearly 14 percent drop in carbon emissions from power generation, accounting for an absolute reduction of 105 million tonnes thus far in 2020 vs. 2019. In contrast, Carbon Monitor’s “Rest of World” group — encompassing all countries other than China, India, USA, Russia, Japan, Brazil and the EU — shaved only 1 percent from its power generation emissions, a decrease of just 27 million tonnes from 2019 emissions of 2,775 million tonnes. A deep dive into the disparate reductions might be useful for devising abatement strategies going forward.
This post only skates the surface of the data made available by Carbon Monitor. Their downloadable Excel file comprises some 36,000 entries: CO2 emissions for every 2019 and 2020 day (Jan-Sept) for five categories by eight countries or regions (some rows capture individual European countries: France, Germany, Italy, Spain and the UK). The daily data provide a quantitative window into that terrifying but bracing springtime period when lockdowns pushed emission rates in the US and other countries 20 or even 40 percent below year-earlier levels. The CM graphics (same link as above) are marvelous as well, as is an Oct. 14 article in Nature Communications by three CM staff distilling and interpreting their quantitative findings.
The second bar graph was added on Nov. 24. Drop us a line (email here) to share your own excavations of the Carbon Monitor data, or if you’d like us to send you our spreadsheet distilling CM’s data as used in this post.


[…] earlier version of this post was published on Tuesday by the Carbon Tax Center. To email Komanoff to share your own excavations of the Carbon Monitor data, or if you’d like […]