Encouraging reports keep emerging about growth prospects for renewable energy. The International Energy Agency’s November report, Renewables 2020: Analysis and forecast to 2025, projects that by 2025 electricity from renewable sources will surpass that from coal, the world’s biggest and dirtiest power source. Also last month, Max Roser, writing in Our World in Data, became the latest journalist to report that in most parts of the world, new wind and solar generating stations can make electricity more cheaply than new plants powered by fossil fuels.
The common driver behind both developments is renewable technologies’ impressive learning curves. Each doubling of cumulative installed capacity has brought a constant price decline, which Roser pegs at about 20% (see chart). The upshot, say Roser and others, is that large investments into scaling up renewable technologies will pay off with still cheaper prices, driving a “virtuous cycle” of ever-cheaper wind and solar power.
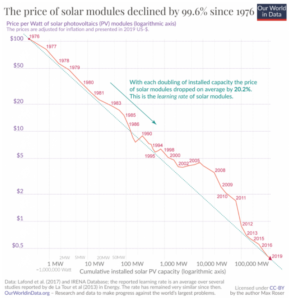 Fossil fuel power had its own learning curve, mostly from ever-larger generators, but these petered out a half-century ago. In the competition between carbon-based and carbon-free power, it seems the latter’s price advantage will only grow. This should ensure that the world’s new power supply comes mostly from zero-carbon sources — even without carbon taxes or other carbon-pricing measures.
These reports generated lots of enthusiasm. The British NGO Carbon Brief headlined its story on the IEA report, Wind and solar capacity will overtake both gas and coal globally by 2024. On Twitter, New York Times columnist Paul Krugman touted Roser’s cost curves as evidence of a “technological miracle” portending that “heading off catastrophic climate change now looks vastly easier than we could have imagined.”
Growth in renewables clearly is cause for optimism. But does it herald rapid decarbonization by itself, without aggressive complementary policies? Let’s consider.
First, the IEA prediction that wind and solar capacity will overtake that of gas and coal by 2024 doesn’t equate to these sources overtaking those fuel’s electricity production by then. Wind and solar generators have lower maximum capacity factors than the coal and gas power plants they are intended to replace. This puts the ascendancy of wind and solar over coal and gas in terms of electricity generated — the metric that matters for cutting CO2 — further off in the future.
Second, IEA’s renewables category included hydropower, which in 2019 generated twice as much electricity as solar and wind combined. (Current energy data in this post are for 2019 and are drawn from BP’s Statistical Review of World Energy, 2020.) But hydro isn’t going to grow much. The most productive sites have already been developed, and opposition is fierce in any case. Going forward, the heavy lifting for renewables must be done primarily by solar and wind.
Unfortunately, the evidence is strong that renewables’ exponential growth phase has ended. This shouldn’t be surprising. As I discussed in my June 9 and July 2 posts, nothing, whether it be technologies or bacterial colonies, grows exponentially — increasing by a given percentage each year — indefinitely. The one notable exception, and the iconic one, has been the steady doubling of the number of transistors on a computer chip, although, as engineering and technology blogger John Loeffler explains, even that exponential growth rate has begun slowing.
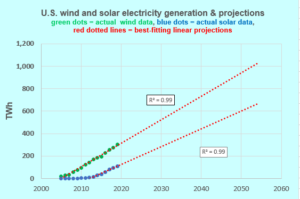
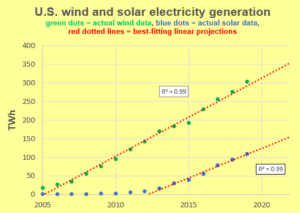 For both solar and wind electricity output, what was exponential growth has now entered the linear phase — increasing by a given absolute amount per year. My earlier posts make this clear at the global level. Since the U.S. is further along in developing renewables than most other countries, their contributions to energy supply here probably represent an upside of their global potential. And linear trends in both solar and wind electricity production now seem well-established for the U.S., as the chart at right shows.
Still, it’s fair to ask why, given the steady percentage drop in prices of solar modules noted by Roser, IEA, Naam and others, solar electricity production (for example) is no longer growing exponentially. There are two main reasons.
First, even with the downward pressure of the learning curve, the drop in the price of modules must level off, due to sheer arithmetic: as costs fall, the same percentage drop in costs translates to ever-smaller numerical drops.
Look again at the cost data from the “Our World in Data” chart at the top of this post, this time plotted on an arithmetic scale.
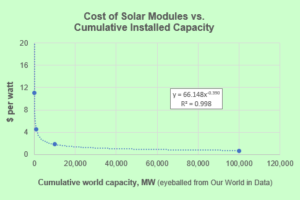 See how the declines in the cost of solar modules level off over time. World installed solar PV capacity currently stands at about 600,000 MW, with a price at the margin of about $0.36 per watt. Using Roser’s relationship of costs declining by 20% with each doubling of capacity, today’s costs are about $0.20 per watt less than five years ago, when world installed capacity stood at around 200,000 MW. If world solar capacity keeps growing at the historical rate, reaching 3,500,000 MW in 2050, its cost will have dropped only another $0.20 per watt — a decline of less than a penny per year.
The second and perhaps more important factor is that the cost of solar modules no longer dominates the total cost of PV installations. Solar projects require inverters, trackers, cabling and mounting, as well as labor and often land. Actually bringing each job to fruition also entails permitting, along with insurance and other business and contractual steps. While small-scale solar installations present somewhat different “balance-of-system” cost scenarios than utility-scale installations, the same general dynamics are at play in both.
Few if any of these balance-of-system costs follow steep learning curves. True, business arrangements have evolved toward greater efficiency as solar has expanded from its initial seat-of-the-pants basis. (This is true for wind power as well.) But these cost economies are finite and modest.
The result is that the total costs of new solar and wind energy facilities are levelling off, as shown in the charts below from lazard.com.
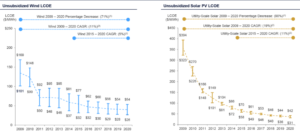
Source: Lazard.com, “Levelized Cost of Energy and Levelized Cost of Storage – 2020,” posted Oct. 19, 2020.
Moreover, these individual-facility costs do not include the costs to accommodate the variable nature of solar and wind power production, such as electricity storage (more on this below). Nor do today’s solar price reports or quotes include safe disposal of the panels once their useful life (of 25 years of so) is over.
Still, could renewables’ ostensible price parity (or superiority) versus fossil electricity augur a return to exponential growth for annual wind and solar additions?
Such a change would be shocking. Current growth trends are so robustly linear, and prospective declines in costs of new wind and solar projects are so gradual, that a shift back to exponential growth seems unlikely, at least under current market conditions.
Even the “monster wind turbines” that the New York Times said in a New Year’s Day headline were “upending the [green-power] industry” are more an extension of increases in turbine scale that have continually cut wind-power costs, rather than the harbinger of a dramatic price breakthrough that could accelerate renewables’ growth rate.
In addition to new policies that would favor renewables, two technological developments could change this picture.
One would be a breakthrough in electricity storage technology. A recent study by Jessika Trancik’s group at MIT estimates that dropping storage costs to approximately $150/kWh would allow variable sources such as wind and solar to fulfill all but 5 percent of electricity requirements — not quite a carbon-free grid, but almost. That would entail a roughly five-fold reduction from current costs, a development that energy blogger David Roberts believes may be closer than we think.
The other change would be increases in energy efficiency sufficient to allow the growth in renewables to slash fossil fuel combustion rather than simply cut down on its growth, even as the world replaces with carbon-free electric power the carbon-based liquid fuels that today power transportation and most space heating and process heat. Unless those energy requirements are reduced significantly, replacing them with electric power — as decarbonization requires — will vastly increase the quantity of electricity needed to power our economy.
Let’s assume that major conversions to electricity will be accomplished. How much will electricity demand grow? Projections vary (the uncertainties are wide), but it is likely that without extensive cuts in consumption, electrification sufficient to eliminate U.S. fossil fuel combustion will at least double electricity demand.
For example, Princeton University’s new, ambitious Net-Zero America modeling effort has concluded that all-electric scenarios eliminating U.S. carbon emissions by 2050 will require between a doubling and quadrupling of nationwide electricity generation. (See p. 75 of the linked report.)
This daunting increase range is broadly consistent with global projections by the U.S. NGO Resources for the Future, in its Global Energy Outlook, as well as estimates made with the En-ROADS simulation tool discussed in my July post. On a far smaller scale, it is also in harmony with the projection developed for my home state of New Jersey’s 2019 Energy Master Plan, that fully electrifying transportation and buildings sectors in that state will more than double electricity requirements by 2050.
 If in fact U.S. electricity usage more than doubles by 2050, our total electric output then will reach 8,800 TWh. Yet wind and solar, growing at their current linear rate, are on track to provide the U.S. only about 1,550 TWh, or just 18% of that total, as our final chart indicates. Without concerted effort to change the current trajectory, most of the remaining electricity will come from combustion of fossil fuels.
The time left to phase out carbon fuels and avoid the worst effects of climate change is dwindling fast. Growth in solar and wind isn’t close to accomplishing that. Denying this borders on magical thinking. And bad magic at that, since it could undermine efforts to enact a powerful and potentially progressive tool to support U.S. decarbonization: a transparent and robustly rising price on carbon.
Ed. Note: The paragraph about “monster-size” wind turbines was added several days after this post went up.

Charles Hall says
I think this is a pretty good overview of the situation. We found in Prieto and Hall (2012) that the modules represented only one third of the energy cost of the installation (and that not including the backups).
The best assessment of this I know was by Inigio CappellanPerez:
Dynamic EROI of the global energy system in future scenarios of transition to renewable energies See discussions, stats, and author profiles for this publication at: https://www.researchgate.net/publication/327346201
Standard, Point of Use, and Extended Energy Return on Energy Invested (EROI) from Comprehensive Material Requirements of Present Global Wind, Solar, and Hydro Power Technologies Carlos de Castro 1,2,* and Iñigo Capellán-Pérez 1 Energies 2020
Mike Aucott says
Thanks much Charlie. These look like quite useful references.
Drew Keeling says
This is a persuasive and sobering analysis. It places the “techno fix” approach to decarbonization in a solidly realistic context. Time is not on our side when it comes to global climate change mitigation, and our generations have dallied too long without adequately clear, sensible and effectively-pursued priorities.
Thanks.