Last November, we posted a story, Downturn in U.S. driving led 2020 global CO2 decline, with this lede:
The world’s emissions of carbon dioxide from burning fossil fuels diminished by more than 1.6 billion metric tons in the first three quarters of 2020 from the same period in 2019, a decline of 6.3 percent. Fully one-fifth of the decline, 320 million tonnes, was due to the nearly 25 percent drop in ground transport in the United States, according to data compiled and made available this week by Carbon Monitor, an international collaboration of energy and climate specialists providing regularly updated, rigorous estimates of daily CO2 emissions.
Scratch that. Carbon Monitor has reformulated its carbon emissions data for U.S. ground transport. The earlier-reported drop of almost 25 percent in U.S. car and truck emissions has been revised to a mere 9 percent shrinkage — a drop of 153 million tonnes for all of 2020 vs. 2019, rather than a decline of 320 million tonnes for Jan-Sept.
With that revision, as well as natural evolution from adding fourth quarter data, we have these results for 2020 vs. 2019:
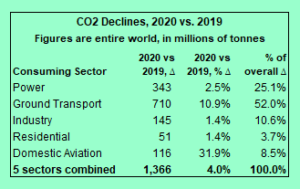
- Global CO2 emissions fell by 1.37 billion metric tons, a drop of 4.0 percent.
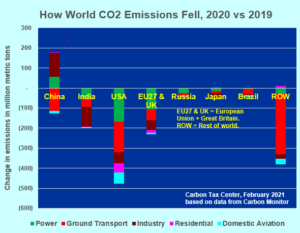
- All eight regions defined by Carbon Monitor registered emission declines, with the exception of China, where emissions rose by 0.5%. Excluding China, world emissions fell by 6.0 percent.
- The U.S. accounted for 35 percent of the global decline, falling by 477 million tonnes. In percentage terms, the U.S. decline, 9.4 percent, was second only to Brazil’s 9.8 percent.
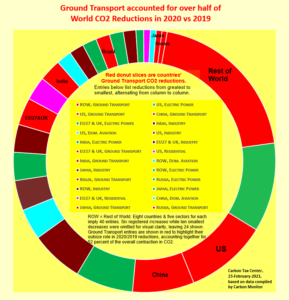
- Carbon Monitor calculates emissions for 8 regions and 5 categories, which makes 40 “nation categories” (8×5). The biggest numerical drop by far was in ground transport (driving ) in the “Rest of World” catch-all category: 370 million tonnes, or 13.9 percent, a figure that feels suspiciously large.
- With that caveat, ground transport accounted for 52 percent of the net decline in emissions, falling by 710 million tonnes. The greatest percentage drop was in domestic aviation, 32 percent.
Carbon Monitor, a British-based NGO that labored mightily to collect the underlying data, hasn’t posted an explanation for radically revising the U.S. ground transport datum. We wrote to its volunteer staff in mid-January to report that gasoline and diesel fuel data from the U.S. Energy Information Administration indicated much lesser drops — around 13 percent in CO2 emissions from automobiles and 9 percent for trucks, rather than their 24.5 percent for ground transport overall.
 We suggested further that CM’s methodology, which relied on extrapolating from reported changes in urban traffic congestion, appeared to grossly underweight changes in suburban and rural driving, which would have created a sharp upward bias in the group’s estimated reduction in emissions. It now appears our hunch was right.
The green table at right shows that by far the steepest decline in global emissions came in domestic aviation, at 32 percent. (International air travel isn’t counted in any of the categories.) Many air travelers deemed it unwise to spend hours in confined aircraft spaces, and teleconferencing filled in for most business travel. The reduction rate might have been higher still, but for “ghost flights” resulting from byzantine government regulations and financial incentives.
 The donut chart at left provides another view. It arranges 24 of the 40 “nation categories” in descending order of their 2020 vs. 2019 emission reductions. (Four other categories had emissions increases, two were flat and another ten were too minor to warrant including.)
Finally, some U.S. takeaways:
- The overall U.S. emissions decline, 9.4 percent, far outweighed the 3.5 percent year-on-year drop in real (inflation-adjusted) gross domestic product, or GDP.
- The decline in CO2 emissions from U.S. power generation, 166 million tonnes, slightly outstripped the 153 million tonne decline in ground travel. In percentage terms, the 10.3 percent drop in electricity emissions outpaced the 9.3 percent decline in emissions from cars and trucks.
- Final 2020 electricity figures will almost certainly show coal-fired electricity production and tons of coal burned at power plants at their lowest levels since before the 1973 oil embargo and OPEC-engineered oil price rises that spurred conversion of oil-fired generation to coal. (Even in 2019, U.S. coal-fired plants produced their fewest kilowatt-hours since 1978, the year preceding the Three Mile Island reactor meltdown, which also spurred an overnight switch to coal, as dozens of reactors were throttled for safety checks.)
U.S. emissions (not to mention world CO2 as well) appear set to roar back this year, as the imminent Democrats’ relief-stimulus package injects nearly two trillion dollars into the economy and pandemic-weary Americans seek to regain normalcy by spending and traveling. The Biden administration will need to move broadly and rapidly with low-carbon infrastructure and incentives to keep U.S. carbon emissions from rebounding sharply over the next several years.


[…] Update: Komanoff and Streetsblog learned in January, 2021, that the data source for this post, Carbon Monitor, employed a questionable methodology to estimate the downturn in U.S. tailpipe emissions. Prodded by Komanoff, CM revised its approach when it published full-year CO2 data in February. The new data indicate a much lesser (9% rather than 24%) decline in U.S. tailpipe emissions in 2020 vs. 2019. For a fuller account, see Komanoff’s Carbon Tax Center post, Data Correction Reveals 2020 CO2 Shrinkage Was Less Than Reported. […]