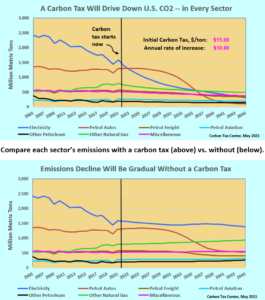
We’ve just posted an update — the first in four years — to our carbon-tax spreadsheet model, CTC’s easy-to-use but powerful tool for forecasting future emissions and revenues from possible U.S. carbon taxes.
The model, which runs in Excel, accepts any carbon tax trajectory and spits out estimated sector-by-sector and economy-wide emission reductions, year by year.
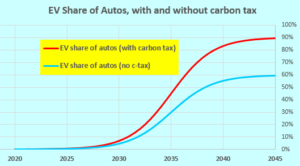
 The big new feature is explicit modeling of transportation’s conversion to electric propulsion. The model establishes baseline projections of electric power’s 2050 shares of car travel (60 percent), freight hauling (30 percent), and airplane seat miles (10 percent, probably by hydrogen, which, like battery power, will be produced by electricity); it then elevates these percentages in the case of robust carbon-taxing.
Our updated model also includes, as it must, the added electricity to power electric transport. This quantity is substantial, accounting for around 20 percent of all electricity usage by the 2045 end of the forecast period. Yet the resulting emissions never reach 100 million metric tons of CO2, on account of the rapid decarbonization of electricity production predicted in the model. (For comparison, note that total U.S. carbon dioxide emissions this year from burning fossil fuels are likely to be between 5,000 and 5,500 million metric tons.)
Without a tax on carbon emissions, however, electrified transport will add 200 million metric tons to annual U.S. emissions two decades from now — even though fewer cars, trucks and planes will be electric-powered, due to the absence of a carbon price signal. The higher level is because of the slower pace of decarbonization of electricity generation without a carbon tax.
A Carbon Tax Could Put Biden’s Ambitious 2030 Target Within Reach
At last month’s Earth Day climate summit, President Biden committed the United States to “a 50-52 percent reduction from 2005 levels in economy-wide net greenhouse gas pollution in 2030.” Since his target encompasses greenhouse gas pollutants like methane and chlorofluorocarbons and also appears to take credit for carbon sequestration in soils and forests, it’s possible that it assumes only a 40 percent reduction in fossil fuels’ CO2 along with very aggressive reductions in other areas.
A robust carbon tax could put a 40 percent CO2 reduction target nearly in reach. Our modeling suggests that with a carbon tax starting next year at $15 per ton of CO2 and rising by $10 a ton each year, U.S. 2030 carbon emissions from burning fossil fuels would be 36 percent less than in 2005. Without a carbon tax, the 2030 vs. 2005 reduction is limited to 14 percent — the same as in 2017. And while Biden’s laudable plans to ramp up energy efficiency and renewable electricity will cut emissions somewhat, raising the reduction figure to 20 percent is probably the limit to what the U.S. can accomplish by 2030 without a rapidly rising carbon tax.
How We Model Electrified Transport
Vehicle electrification is beginning to take off, propelled by improving battery performance, zero-emission-vehicle mandates in some states, and Biden administration plans to jump-start battery charging facilities across the country.
Like other innovative mass-market technologies — smartphones, VCR’s and microwave ovens come readily to mind — dissemination of EV’s is likely to follow an s-curve rather than a linear (straight) path. We use such a curve to represent the rate of uptake, with the halfway point assumed to be 2035.
As noted, we posit that even without a significant carbon price, electric or hydrogen propulsion will account for 60 percent of U.S. driving, 30 percent of goods movement and 10 percent of aviation by 2050. But a robust carbon tax will speed the transition, not just by widening electric vehicles’ per-mile price advantage over gasoline, diesel and jet fuels but by creating tipping points, e.g., accelerating the replacement of gas stations with charging stations. We assume that a robust price — $100 or higher (in 2020 dollars) by 2031 — will lift our 60/30/10 percentages by half, to 90/45/15.
The reductions in U.S. petroleum requirements predicted for that scenario by our model are striking. By the mid-2030s, when the penetration of electric transport is at its halfway point and kicking in fast, total oil consumption is projected to be nearly four million barrels a day (25 percent) less than in a business-as-usual, no-carbon-tax future, and nearly eight million barrels a day less than the actual 2005 rate.
Other Features of CTC’s Carbon Tax Model
Here are other defining features of our carbon-tax model:
1. It’s baselined to 2019: That’s the most recent year with available data. It’s also a more solid baseline year than 2020, when the pandemic drove down key fossil fuel use sectors, especially driving and flying.
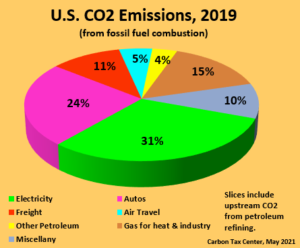
2. Oil refining is allocated to usage sectors: “Upstream” carbon emissions from refining petroleum products are assigned to the respective end-use sectors such as driving, goods movement and aviation. The model doesn’t ignore analogous add-ons for electric transportation; we add 20 percent to the current watt-hours per mile figures for the respective travel modes to allow for electric-intensive battery manufacture.
3. We smooth the uptake of the carbon tax: Big jumps in carbon tax levels won’t be fully reflected in fossil fuel use right away. Households and businesses need time to adapt to costlier fossil fuels. The model captures these lags through a ceiling in the tax increment that can be “absorbed” in any one year and carries over any excess. This feature is helpful for trajectories like the Whitehouse-Schatz bill, which kicks off with a bang at $45 per metric ton of CO2. Under our default setting, in which the economy in any year is assumed able to process only tax increments up to $15 per ton of CO2, the reductions from that initial $45/ton charge are spread over three years rather than, unrealistically, assigned to the first year.
4. Demand vs. supply impacts: The Summary page has a section comparing projected CO2 reductions from changes in fuels’ carbon intensities (“supply side”) versus reductions from reduced energy usage (“demand side,” e.g., lower electricity purchases, less driving or flying). Under our default carbon tax — starting at $15 per ton of carbon dioxide and rising annually at $10/ton — an estimated 64% of projected CO2 reductions are on the supply side (i.e., due to decarbonization); a substantial minority, 36%, come about through reduced demand, illustrating that subsidies-only policies miss out on huge CO2 reductions. Indeed, clean-energy subsidies undercut decarbonization by stimulating energy usage through lowered energy prices, a phenomenon we noted in our 2014 comments to the Senate Finance Committee.
5. Transparency: All model assumptions, formulas and algorithms are in plain sight. This includes our price-elasticity assumptions that translate higher fossil fuel prices into lower demand trajectories, as well as the income-elasticities that predict more driving, flying, electricity usage and so forth as incomes rise. To be sure, some hunting may be required; the model has nearly 25,000 equations, after all. But the stepwise procedures we use to calculate year-to-year changes in each sector’s activity level, fuel use and emissions are all annotated, a mighty assist to anyone wishing to get deep into the model’s workings.
6. Easy to use: For example, we just read today’s WaPo op-ed, Biden should embrace a carbon tax, by veteran Washington and Wall Street insiders Henry Paulson and Erskine Bowles. Once we got past the political tone-deafness of urging a carbon tax now (“Biden’s task is to pass bold, progressive, popular legislation to help Democrats expand their Congressional majorities in 2022 and 2024 and give him a thumping second-term mandate to boot,” we wrote last month; “then, and only then, can he risk a carbon tax”), we saw Paulson and Bowles’ claim that a carbon tax starting at $40 per ton and increasing by 5 percent per year above the rate of inflation “would reduce U.S. emissions to 50 percent below 2005 levels by 2035.” It took only seconds to plug those figures into our model and see that in year 15, which would be 2036 or later, the tax would reduce emissions by only 39 percent. While that’s a big reduction, it’s still a ways below the council’s claimed 50 percent.
The spreadsheet is user-friendly, powerful and, if you’re so inclined, captivating. We hope you’ll download it — here’s the link again — and run it in Excel. See for yourself the relative efficacy of a carbon tax trajectory that increases by a fixed amount each year, as does the Energy Innovation and Carbon Dividend Act supported by Citizens Climate Lobby, vs. one like the Climate Leadership Council’s (touted by Paulson and Bowles) that starts high but rises only by moderate, percentage-driven amounts.
As you work (play?) with the model, jot down your thoughts so you can tell us what works and what needs improving. Especially the latter, as we just wrapped the update and there are bound to be glitches. We’d love to hear from you.


James Handley says
Charles,
You seem to assume that carbon taxes are a drag on the economy and thus must be postponed. In a peer-reviewed analysis published last year by the National Bureau of Economic Research, Gilbert Metcalf and Jim Stock retrospectively analyzed the macroeconomic impact of carbon taxes (and their equivalents) in the EU. They found that taxes on climate pollution had slightly positive effects on GDP growth and employment and, as we would expect (and your model illustrates), emissions reduction effectiveness depends strongly on the tax rate and breadth of coverage. Gernot Wagner recently summarized and linked to their paper: https://www.bloomberg.com/news/articles/2021-04-30/carbon-taxes-cut-emissions-not-jobs-or-economic-growth
Charles Komanoff says
Thanks James. Good to know about the Metcalf-Stock analysis, but drag on the economy isn’t a reason I hope the Biden administration will abjure a carbon tax in the next year and a half. Rather, as I wrote in my “Long Game” post last month and quoted in this one yesterday, it’s to avoid the inevitable political backlash from a carbon-tax push that could threaten the Democrats’ House and Senate majorities next November. (“Biden’s task is to pass bold, progressive, popular legislation to help Democrats expand their Congressional majorities in 2022 and 2024 and give him a thumping second-term mandate to boot. Then, and only then, can he risk a carbon tax.”)
James Handley says
Isn’t the “inevitable political backlash” guaranteed no matter what policies Democrats enact? As we both know, there’s always been a political excuse to delay taxing pollution, especially climate pollution; it’s a safe bet that there always will be.
LornaSalzman says
I venture to say that some Republicans might support a fee and dividend, as some business have already. Why give the Democrats an excuse (the next election) to delay? They’ll think of another excuse anyway. The first problem is dealing with the”liberals” and the left and their utter stupidity in opposing it.
Has anyone noticed that reducing energy use hasn’t been mentioned since 1973? By anyone? Is this not weird? And indefensible? If no one wants a carbon tax, then let’s promote rationing.. And has anyone noticed that the whole environmental movement has collapsed? Completely taken over by the social justice jerks, who are the primary criminals in destroying the movement. The planet is burning and they
can do nothing but complain about “micro aggressions” and play the victim. They are actually frauds. They have no interest in anything but Power and in pushing their narrow ideology on everyone else. The last time that happened was under Stalin if I recall correctly.