NY Times, Documents Show E.P.A. Wants to Erase Greenhouse Gas Limits on Power Plants, May 24.
In the absence of concerted climate-focused policy, cheap renewable energy and booming demand may be a recipe for adding green energy without retiring the dirty stuff, letting emissions climb as the rollout of renewables continues.”
NY Times science and climate writer David Wallace-Wells, in Climate Change Urgency Has Declined. The Green Transition Hasn’t., April 30.
5 years on, the Indian Point disaster is its shutdown

Indian Point nuclear power plant, on the east shore of the Hudson River, in northwest Westchester County, north of New York City. Units 2 and 3, shown in photo, were permanently shut at midnight on April 30, 2020 and April 30, 2021, respectively. A smaller, prototype reactor, Unit 1, operated from 1962 to 1974. Photo: Eric Harvey for the Peekskill Herald, published Sept 24, 2024.
Once upon a time, hearing “disaster” and “Indian Point” in the same sentence probably meant that the nuke plant had just spilled radiation into the Hudson. Or maybe a whistle-blower was postulating a meltdown scenario that could trigger a lengthy shutdown, ensuring the plant’s capacity average wouldn’t surpass 50% — the generating equivalent of a ballplayer batting .200.
But that was last-century. Now nukes are climate-friendly, thanks to atomic fission’s sidestepping fossil fuels’ heat-trapping carbon emissions. Not only that, at century’s end Indian Point vanquished its on-line reliability problems. Starting in 2001, it racked up year after year of chart-topping generating performance right up to the plant’s forced demise that commenced five years ago tonight.
 From a climate standpoint, the true Indian Point disaster is the plant’s closure and dismantlement. Both reactors are now kaput, their reactor cores chopped up. Unsurprisingly, the effort to decarbonize the state power grid — New York’s lowest-hanging climate fruit — is in reverse. Emissions are mounting, and in New York City and other downstate areas formerly supplied by Indian Point, electricity is getting costlier and less dependable.
Turning off Indian Point has devastated electricity decarbonization in NY State
Rarely are opposing trends as clear as the two in the chart directly below. In the five years from 2019, just before Indian Point’s closure began, the amount of electricity made by burning fossil fuels in New York State grew in tandem with the drop in nuclear generation caused by Indian Point’s absence.
Over that 5-year term, as electricity generated statewide with nuclear power fell by 17.7 TWh, electricity generated with fossil fuels (essentially fracked methane gas) rose by 15.4 TWh a year. (A TWh, or terawatt-hour (TWh), equals a billion kWh’s.)
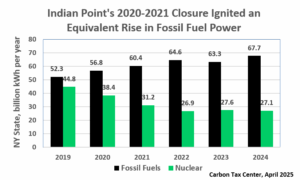
Chart by writer, from NYISO data extracted by Isuru Seneviratne. More details in paragraph directly below.
The loss of generation from Indian Point — 16 to 17 TWh a year, based on the 2001-2019 average — was supposed to be made up with “renewables.” Shutdown proponents, led by the advocacy group Riverkeeper, practically guaranteed it. A press release that the group issued as the hours counted down on April 30, 2020 was titled Indian Point 2 shuts down; NY’s renewable energy transition, for example. (Connoisseurs of the legendary “Dewey Defeats Truman” headline should flock to that Riverkeeper web page.) Yet increases in renewables can barely be detected in 2019-2024 statewide generation changes.
Over those five years, electricity produced statewide from wind, solar and burning forest products did grow by a healthy 70 percent. But because the starting base was small, the increase in absolute terms was a modest 6.2 TWh. Hydro-electricity, moreover, fell by 2.3 TWh, cutting the net 2019-2024 boost from renewables to a measly 3.9 terawatt-hours. Virtually the entire slack from shutting Indian Point had to be taken up by increased burning of fossil fuels — not because of gas greedheads but because no other power source was available. (The various 2019-2024 generation changes meticulously compiled by the NY Independent System Operator have been distilled into a comprehensive chart created by Isuru Seneviratne, who monitors state electricity data for the advocacy group Nuclear NY.)
Renewables won’t soon make up Indian Point’s lost output
Renewable-power sources being developed for NY State can be placed in three groups.
- 1,200 megawatts (MW) of new hydroelectric power being brought to NY State from Quebec via a new 339-mile long transmission line known as the Champlain Hudson Power Express (CHPE).
- Wind farms in the Atlantic Ocean off Long Island, beginning with the 2,070-MW Empire Wind 1 and 2 arrays south of Long Beach (my hometown).
- New utility-scale on-shore wind and solar in various stages of permitting and construction, comprising nearly 50 ventures totaling around 7,000 MW.
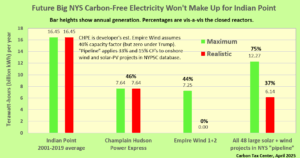
Empire Wind generation is zeroed out in “realistic” scenario due to Trump’s fear and loathing of offshore wind. Realistic scenario for solar and (onshore) wind in project pipeline assumes one-half of maximum generation.
The raw megawatt figures above may appear imposing, but less so when we account for three crucial factors:
(i) Only CHPE can provide reasonably consistent electricity, with a capacity factor between 70% and 75%; the wind and solar farms are weather- and astronomically-limited to much lower annual outputs: I posit 40% (offshore wind), 33% (onshore wind) and 15% (solar).
(ii) Offshore wind is almost certainly dead in the water (sorry!), due to the U.S. president’s implacable hatred (rooted in his belief that a nearby wind-power venture would threaten the profitability of one of his Scotland golf courses). [See addendum at end of this post.]
(iii) Not all projects in the state renewables “pipeline” will prevail through permitting obstacles, local opposition and financing problems.
The bar chart at right adjusts for these factors by presenting the prospective the three categories of new carbon-free electricity alongside Indian Point in annual terawatt-hours. The green bars sum to 27 TWh, indicating total new carbon-free generation nearly two-thirds greater than that lost when the nuke plant was taken away. The more-realistic red bar sum, 13.8 TWh, is only around half of the maximum, and is less (by 14%) than Indian Point’s lost contribution.
Let’s also face that having new renewables make up for the generation lost by closing Indian Point is a pathetically low bar. New wind and solar were supposed to contribute mightily to stopping climate change by pushing fossil fuels out of the grid . . . which they cannot do at present if their output must stand in for the carbon-free output that Indian Point was prevented from providing after 2020.
Lessons learned?
The outlook for decarbonizing the NY State power grid is grim, even if there’s a post-Trump world in which the U.S. government doesn’t throttle offshore wind as it has tried (unsuccessfully, thank goodness) to scuttle New York’s congestion pricing program. As the last bar chart shows, even bringing Empire Wind to fruition won’t make up half of Indian Point’s lost carbon-free output.
And this post hasn’t touched on the closure’s prospective toll on downstate electricity rates and reliability. Nor has it treated the possibility that deteriorating U.S.-Canada relations will put a crimp in (or surcharges on) hydro-electricity from CHPE whose expected commencement next year is the only bright spot on the horizon, so far as large projects are concerned. (Rooftop solar has gained a solid foothold in New York State, which ranks third in the U.S. in the number of homes with solar panels, according to Solar Insure. Yet making up for Indian Point’s lost carbon-free output would require roughly one million new solar homes in the state — a 5-fold addition to the 200,000 existing solar homes in the state at the end of 2024.)
Here are three lessons learned from the premature closure of Indian Point:
Lesson #1. A robust carbon tax might have saved Indian Point. Based on its average 2001-2019 electricity output, a tax of $100 per ton of emitted CO2 would have conferred an annual carbon-avoidance value of three-quarters of a billion dollars on the Indian Point plant. (Calculation: 16.5 TWh/year x 10^9 kWh/TWh x 0.9 lb of CO2/kWh (per EIA, reduced slightly from that source’s 0.96 lb average to weed out peaker plants) x 1/2000 tons per lb x $100/ton.) A monetary bounty of that magnitude would have made it more difficult for Riverkeeper and then-Gov. Andrew Cuomo to engineer Indian Point’s closure. (During the decade preceding closure, the actual price under the Regional Greenhouse Gas Initiative (RGGI) to emit a ton of CO2 averaged 20 times less: around $5/ton.)
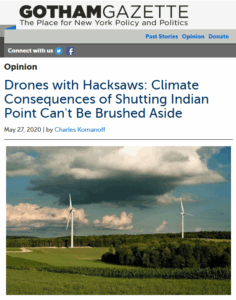
Image from my 2020 post bemoaning the pending closure of Indian Point. (Link in text at right. Gotham Gazette ceased publication in 2023.)
Lesson #2. Self-appointed environmental-interest groups should not be the primary arbiter of the public interest in climate-critical matters. “Climate was not at the table when Indian Point’s fate was being sealed,” I wrote in May 2020, weeks after Indian Point began to be shut down. Riverkeeper was at the table, of course, supported by several other prominent environmental organizations whose institutional biases led them, in my view, to overestimate the real-world availability of wind and solar electricity, undervalue Indian Point’s carbon-free benefit, and over-emphasize the risks of the nuclear plant’s continued operation. The result was that the “climate consequences of shutting Indian Point [were] brushed aside,” as suggested in the subhead to my 2020 post.
Lesson #3: New Yorkers must consider adding more nuclear power capacity to the state grid. I’m starting to re-evaluate the proposition that New York State can achieve a zero-emissions electric grid without adding considerable nuclear power capacity. This widely held viewpoint (“article of faith” might be a more apt term) was critiqued in late 2023 by PhD physicist and policy analyst Leonard Rodberg, whose analytical acumen and probity I’ve admired since the 1970s, when we were colleagues in the safe energy movement, as it was then called. Len’s detailed analysis concluded that approximately 29 GW of new nuclear capacity — the equivalent of 15 Indian Point plants — will be required in addition to large amounts of offshore wind as well as solar and other “distributed” power — to reliably and affordably decarbonize the state grid by 2040 while satisfying load growth from electrifying much of the space heating and vehicular transportation now provided by combusting fossil fuels.
Addendum
Heatmap and other news outlets reported on May 20 that the U.S. Interior Department lifted its April 16 stop-work order indefinitely halting construction of the 810-MW Empire Wind 1 in the Atlantic Ocean south of Nassau County, NY. This hopeful development is tempered, however, not just by the Trump administration’s notorious fickleness but by the fact that if and when completed the 810-MW wind farm will offset only a sixth of the carbon benefit that was destroyed by Gov. Andrew Cuomo and Riverkeeper’s closure of Indian Point. See graph.
Defending NY’s Congestion Pricing Program
This post first appeared in The Washington Spectator, which posted it yesterday, Feb. 19. We’ve edited it slightly: swapping in a more finely-grained pie chart of trips to the zone by mode, adding a Hochul-vs-Trump graphic, and substituting excerpts from and a link to Gov. Hochul’s Grand Central Station press conference in place of an earlier quote from Reinvent Albany head John Kaehny. The remaining content is the same.
— C.K., Feb. 20, 2024
So much winning. Unjammed bridges and tunnels. Speedier deliveries. On-time buses. Calmer, more inviting streets. Fewer traffic crashes. Repairmen getting to more jobs.
Not Donald Trump’s kind of winning, however. Trump didn’t invent congestion pricing. A Nobel economist — a Canadian, at that — worked out the theory 60 years ago, and a ragtag crew of transit lovers, car inquisitors and dyed-in-the-wool urbanists spent decades importuning New York’s political establishment to put it into practice.
The president had nothing to do with the toll plan. In fact, everything about it screams woke — or does to troglodytes too blinkered to see that congestion pricing’s biggest beneficiaries are motorists, who daily reap substantial dividends in saved travel time.
So it came as no surprise that today Trump’s transportation secretary Sean Duffy told NY Gov. Kathy Hochul that the president intends to rescind federal approvals and to terminate the toll program, which went into effect in early January.
Fortunately, officials at the state-chartered Metropolitan Transportation Authority, which operates the city’s buses, subways and major bridges, and was invested half-a-dozen years ago with legal authority to administer the congestion pricing program, were ready. Mere minutes after Duffy’s announcement, the MTA filed a 51-page complaint in federal court charging Duffy, U.S. DOT and the Federal Highway Administration with usurping their statutory authority and seeking to bar them from interfering with the tolls.
Ozempic for Cities
“Am I tripping?,” shock jock Kai Cenat asked on Hot-97 last month. “Congestion pricing might actually be working.” Self-styled housing advocate YIMBYLAND pointed to plummeting subway crime and dubbed congestion pricing “the Ozempic of urbanism,” musing, “I wonder what else it can fix.”
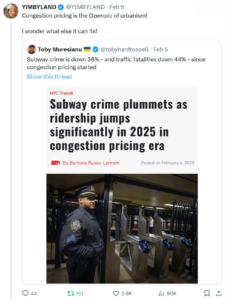
Congestion pricing’s success at cutting traffic is winning converts.
The answer is: quite a lot. The unmistakable takeaway thus far is that just a few fewer cars goes a long way. The drop in the number of vehicles driven into the toll zone is probably 10 percent tops (conclusive data isn’t out yet). But it feels like more. In the papers and on TV, drivers are reporting less time stuck in their cars. In a recent poll, habitual car commuters to Manhattan strongly backed congestion pricing.
The “stick” that has dialed down traffic’s manifold negatives is actually fairly modest — a $9 toll to drive into Manhattan south of 60th Street. Compare that to my calculation that a median car commute to and from the congestion zone slows down the other cars, trucks and buses in its gravitational field by an aggregate of minutes and seconds that equate to $100 worth of lost time. As the toll “carrot” kicks in, in the form of $15 billion worth of transit improvements that the toll revenues will bond, subway travel will get better and safer, helping shrink car use even more.
To be sure, traffic will rebound somewhat as drivers feel the allure of less-clogged roads. But unlike traffic cops or synchronous traffic lights or other traffic-taming nostrums perennially attempted in New York and other U.S. cities, congestion pricing will yield a durable drop in traffic. Sure, call it a miracle. I have. But the eased traffic is the predictable product of pricing “congestion causation” into car trips that collectively create traffic jams.
The Serpentine Road to Jan. 5
What looks straightforward in print was, in practice, anything but. In Diary of a Transit Miracle, published in The Washington Spectator last April, I traced the 50-year effort to define, scope, build support for, and legislate New York congestion pricing. The miracle, I wrote, was three-fold: “Winners will far outnumber losers; New York will be made healthier, calmer and more prosperous; and that this salutary measure is happening at all, after a half-century of setbacks.”
Soon enough, the triumphant odyssey was torpedoed in the bow. On June 5, Gov. Kathy Hochul, whose office has authority over the MTA and, thus, over congestion pricing, peremptorily and indefinitely “paused” its June 30 start — a perfidy I dissected in Hochul Murder Mystery. The outbreak of pro-congestion pricing support would persist, I predicted, returning the governor to the fold — as happened in November, after the election. Congestion pricing would go into effect on Jan. 5, though scaled back from the June 30 rates. The intended $15 peak toll was lowered to $9, with truck tolls and taxi and Uber surcharges reduced by 40 percent as well.
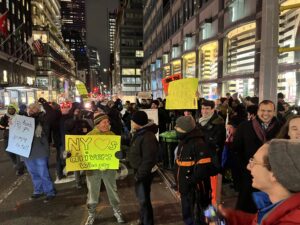
Congestion pricing supporters at Lexington Ave. and 60th Street, 12:03 a.m. Jan. 5, 2025. I’m at center, foreground, holding yellow sign and chatting with journalist-author Christopher Ketcham. Tall man smiling at right is Rit Aggarwala, who led Mayor Bloomberg’s 2007-2008 bid to enact congestion pricing and now heads the city’s Dept of Environmental Protection. Photo: Sproule Love.
Even diminished, congestion pricing promised much for New York — especially if Hochul or a successor adhered to her pledge to raise the toll to $12 in 2028 and, in 2031, to the full $15. Toll supporters gladly took the win. As midnight approached on Jan. 4, we thronged Lexington Avenue and 60th Street, braving the midnight cold to count down the final seconds of life without congestion pricing.
We were festive and appreciative. “NY ♥s drivers who pay,” read my sign. “Thank you for paying the toll,” said another. “You’re making history!,” proclaimed a third. No one asked if “you” denoted the crowd, or the drivers whizzing by, or our fair city. For a bright, shining hour, it was everyone.
Why Trump Wants to Eradicate Congestion Pricing
Once upon a time, a wannabe developer looking to make a mark in Manhattan might have bet on congestion pricing. Wharton might have schooled him that prices beat queues at sorting supply and demand. He might have paid notice in the 1980s as true-life real estate titan Dick Ravitch used his pulpit as MTA honcho to hammer home that a thriving Gotham required functional transit, which in turn required robust new revenue streams. Throughout Mike Bloomberg’s mayoralty, he might have listened as Kathy Wylde, chief of the blue-ribbon business group Partnership for New York City, repeatedly decried region-wide traffic gridlock as a $20 billion a year tax on residents and businesses.
Meanwhile, of course, Donald Trump did none of those things. From time to time he fulminated against congestion pricing, though more as a nuisance like, say, water-saving flush toilets. As president he escalated his rhetoric. In a Feb. 8 interview with the New York Post, Trump called the tolls “horrible” and “destructive to New York.” Ignoring mounting evidence like January’s big year-on-year uptick in attendance at Broadway shows, he dismissed the reductions in traffic jams, rationalizing that “Traffic is way down because people can’t come into Manhattan and it’s only going to get worse.”
That’s your standard “windshield perspective” at work, oblivious to the reality that barely one-fifth of folks coming to the Manhattan congestion zone arrived in a private vehicle prior to congestion pricing. (See chart.) True enough, a few days after Trump’s Post interview, local news sources reported a rise in Manhattan foot traffic in congestion pricing’s first month compared to the year before.
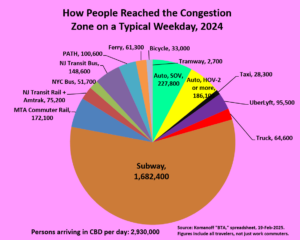
Pre-tolling, only one-fifth of person-trips to the congestion zone were via private vehicle; among regular work-commuters the share was even smaller.
Still, the Trumpian brain gazing at congestion pricing sees not a respite from traffic gridlock but oil barons’ birthright squandered on mass transit and climate. Ironically, the tolls’ direct hit to petroleum and carbon will be relatively modest; by design, congestion pricing applies just to a sliver of city driving.
If congestion pricing had a motto, it would be, “Don’t ban cars, bill them” —a mantra lost on The New York Times, which today wrote> that the tolls “aimed to discourage drivers from entering the congestion zone.” Wrong. Congestion pricing seeks to dissuade a smallish fraction of drivers — 10 to 20 percent — from doing so. The other 80 to 90 percent are meant to keep driving to ensure sufficient toll revenues to bond the promised transit investments.
Subtle truths be damned, congestion tolling is anathema to Trumpworld, where policy considerations are buried under monstrous simplification, crude disinformation, coarse slander and, most often, outright lies. Congestion pricing’s crime is that it elevates the collective interest above individual actions that threaten it. It requires drivers to Manhattan’s teeming center to either change their behavior for the common good of congestion reduction, as Paul Krugman put it recently, or to offset some of the harms from their driving by paying into a government-administered kitty — to be invested in transit betterment that will reducing congestion further.
Krugman conjectured that “hostility to New York” may be the true font of Trump’s antipathy to congestion pricing. “Many people, and Trump in particular,” Krugman wrote, “are committed to the view that [New York] is an urban hellscape. A policy that improves life in the city runs counter to that narrative and inspires visceral opposition. And Trump in particular surely wants to hurt a city that has never supported him.”
A balm for New York, if we can keep it
It’s easy to be gloomy about congestion pricing’s ability to overcome Trump’s enmity. Even if the MTA prevails over Secretary Duffy in federal court — and the Authority appears to have a strong hand — the Trump administration has myriad ways to coerce New York State into ending the program. It could slow Federal Transit Administration reimbursements to the MTA for expenditures already authorized and made. Going forward, Trump could constrict routine federal contracts to rehabilitate and build new transit. The rational choice for the state and MTA might then be to give up the toll program.
Or, Trump could hold that power in reserve as leverage to get New York City and State to fall in line or not make waves on a hundred other fronts. Not selling out congestion pricing requires Gov. Hochul to be steadfast and for Mayor Eric Adams, who began distancing himself from the tolls long before bending his knee to Trump, to leave or lose his mayoralty to a congestion pricing defender.
Hochul, for her part, is off to a rousing start. Addressing congestion pricing supporters at NY’s Grand Central Station yesterday, she said:
At 1:58 pm, President Trump tweeted, ‘Long live the king.’ I am here to say that New York hasn’t labored under a king in 250 years and we are sure as hell not going to start now… We stood up to a king and we won then. In case you do not know New Yorkers, we’re in a fight, we do not back down — not now not ever… I don’t care if you love congestion pricing or hate it, this is an attack on our sovereignty, our independence, from Washington. We are a nation of states. We are not subservient to a king or anyone else from Washington… We will not [let] the commuters of our city and our region [become] roadkill on Donald Trump’s revenge tour against New York.
But to feel the governor’s steely determination to keep congestion pricing, it’s best to hear her. This 20-minute YouTube video of her and MTA chief Janno Lieber leaves no doubt that she is more than ready to go to the mat with Trump. She sounds positively liberated.
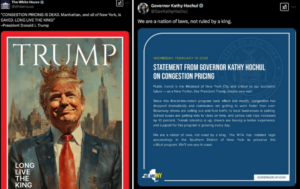
“King” Trump vs. Gov. Hochul. Diptych courtesy of Ryder Kessler, Abundance New York.
Of one thing we can be sure: For Hochul to maintain her brave stance will require continued, sustained organizing — more of the grinding work that brought congestion pricing to life in the first place. The old saw about genius being 1 percent inspiration and 99 percent perspiration applies here.
In this trilogy’s first installment, I gave pride of place to congestion pricing theorist Bill Vickrey. So did the Times’ “Big City” columnist, in an encomium to the Nobel economist last month that implicitly treated the unceasing toil of congestion pricing’s legions of supporters over the years like so many dust bunnies.
But the Jan. 5 victory belongs not just to Vickrey and Ravitch and Wylde, or to Lieber and his relentless staff, but also to Riders Alliance, Reinvent Albany, Regional Plan Association, the Community Service Society, a revitalized Transportation Alternatives, and scores of allied organizations and associations that together coalesced into a civic force for municipal progress, good governance and improvements in our quality of life. And to the journalists who gave our labors prominence.
These organizations internalized and acted on the twin beliefs that having too many cars hurts cities, and that traffic pricing is indispensable for diminishing the automobile’s stranglehold over transportation budgets and road designs. After Hochul’s congestion pricing “pause” last June, they rose as one to block her ploy to concoct a substitute transit funding source. “We never considered it, not for a minute,” Riders Alliance senior organizer Danna Dennis told me earlier this month. “It was congestion pricing all the way.” Likewise for Liz Krueger, state senator from Manhattan’s east side, who rallied her Albany colleagues to render the governor’s gambit dead on arrival.
The result, on Jan. 5, was an epic breakthrough. For the first time in the USA, driving is being assessed a charge for some of the immense harms it wreaks on urban life. At this writing, 45 days on, the facts on the ground are everything that congestion pricing proponents dreamed of and promised. Every new day that dawns with the tolls intact puts the lie to the claims of Trump’s minions that the program is hurting New York. Sure, like Ozempic hurts the chronically obese.
It can feel unfair to have to keep on defending a program that has the force of law and is working wonders. But we must and we will.
We think sometimes that if we live in a city, we’re not vulnerable to natural forces. But we are, and it comes as a huge shock to people. There’s no get out of climate change free card.”
Gavin Schmidt, director of the NASA Goddard Institute for Space Studies, quoted in NY Times, Fires in Los Angeles Area Are Grim Look Into Future, Jan. 12 (print edition headline).
We cannot change the fact that in Florida we have hurricanes, so we shouldn’t be penalized for it. This is why we have the federal government.”
Orlando Diaz, president of the Florida Association of Mortgage Professionals, quoted in Lydia DePillis, Mortgage Regulators Are Shrugging Off Climate Risk. It Could Cost Taxpayers Billions, NY Times, Dec. 7.
Without a tax, everyone will do the same tomorrow as they did yesterday.”
Danish dairy farmer Svend Brodersen, quoted in Taxing Farm Animals’ Farts and Burps? Denmark Gives It a Try., by Somini Sengupta, New York Times, Nov. 26.
A Lesson for NYC Congestion Pricing Came Last Week from Washington State
This post is adaped from my essay yesterday on Streetsblog USA, A Lesson for NYC’s Congestion Pricing Came Last Week from Washington State. It was posted on the eve of NY Gov. Kathy Hochul’s announcement today that she has ended her June “pause” and authorized New York’s Metropolitan Transportation Authority to begin implementing a scaled-down but still-robust version of the original plan, beginning at midnight January 5, 2025.
The Streetsblog post was intended to steel Hochul’s courage and, as we congestion pricing advocates have demanded since June, to prod her to “flip the switch” on the Manhattan toll scheme that was set to go into effect on June 30. It was actually written last weekend with the hope of placing it in the New York Times, but they could not fulfill our request for rapid publication. No matter, the governor’s turnaround was already in the works.
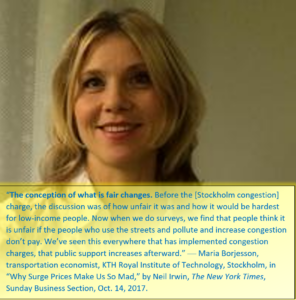
The post takes a few liberties with actual events in Washington, eliding the differences between the straight-up carbon tax measure that voters rejected in 2016 and the cap-and-trade measure that also failed at the ballot in 2018, and the state’s Climate Commitment Act that was enacted into law in 2021 and backed by voters last week. This was in service of the larger point: that the conception of what is fair changes when an effective policy has been given time to work, and that if a policy is wise, politicians should stay the course, confident that public support will emerge.
We’ll have more to say in the coming weeks about the pending rollout of New York’s congestion pricing plan, arguably the first-ever large-scale application of externality pricing in the U.S.
— C.K., Nov. 14.
The first time Donald Trump was elected president, in 2016, Washington State residents also voted down an initiative that would have created the country’s first statewide carbon tax.
The second time Trump won the presidency, last week, Washington residents flipped their 2016 stance on carbon pricing, voting to preserve the comprehensive carbon pricing program that their legislature ended up enacting. And therein lies a message for New York Gov. Kathy Hochul, who paused New York City’s Central Business District toll plan on June 5, just as it was about to go into effect after years of debate.
The message: If the policy is wise, stay the course. The facts on the ground will soon change, generating the political support to validate your policy and prepare you for the next policy battle.
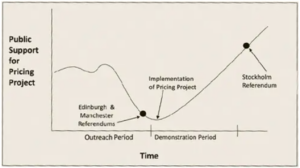
The famous chart of why politicians should stay the course when a policy is good, but unpopular.
Congestion pricing proponents have always known the odds. Taxes are unpopular, check. Driving is a birthright and change is hard, check. We were aware congestion pricing in London and Stockholm had only 40 percent favorability before adoption. But both cities’ experience showed that once traffic visibly lessened and transit improvements got underway, opinion flipped. Roughly 60 percent of residents now support the tolls.
The 2016 vote against Washington carbon pricing was a landslide: 59.3 percent no to 40.7 percent yes. The 2024 vote to keep the state’s carbon pricing law was a landslide in the opposite direction: 62 percent to keep it and 38 to repeal it. Hmm, looks like that 60-40 rule has legs!
A brief look at the law that Washington State voted to keep last week will demonstrate how it’s cut from the same cloth as New York’s congestion pricing.
Washington’s innovative Climate Commitment Act requires fossil fuel companies to buy permits keyed to the carbon content of their fuels. That includes oil refineries, which pass on the costs of the permits to motorists and homeowners as higher prices for gasoline and heating fuels.
The intent is to motivate industry and consumers to curb their carbon dependence, much like congestion pricing in New York would impel motorists to drive less often into gridlocked Manhattan. Sales of the emission permits in Washington are already helping finance electrification and renewable-energy substitutes for fossil fuels, just as New York’s congestion revenues would have bankrolled $15 billion in better transit.
And just as it has been in New York, the road to this decision wasn’t easy. Washington’s climate law took root after voters twice rejected ballot referendums for statewide pricing of carbon emissions by margins of around 60 to 40. (A 2018 initiative failed as well, 56.6 percent to 43.3percent.) But after Democrats won control of the legislature in 2020, Gov. Jay Inslee, a Democrat and unabashed climate champion, pushed through the Climate Commitment Act, much as New York Gov. Andrew Cuomo in 2019 won legislation directing the regional transit authority to institute a congestion pricing system.
This year, however, fossil fuel backers in Washington collected enough signatures to place Initiative 2117on the Nov. 5 ballot. A “yes” vote would have repealed the legislation and discarded the emission permits — perhaps slowing energy price increases but stalling the state’s shift toward clean power.
Well, the returns are in, and supporters of the emissions permit scheme won big.
 True, what was on the ballot in Washington last week — making gasoline and other fossil fuels more costly to elevate lower-emission substitutes from smaller cars to electric cars and, best of all, less driving — isn’t the same as congestion pricing. But it’s a close cousin. What stands out is that a policy rejected by nearly 60 percent of voters in 2016 and again in 2018, won with around 60 percent in 2024. Attitudes can shift when facts warrant.
What enabled the turnaround? A resolute governor stayed the course, allowing the “default” to recalibrate from cheap gas to clean power and letting the public warm to this novel policy for cutting carbon pollution. Once it did, 20 percent of voters came aboard, just like they did in London and Stockholm.
New York hasn’t been as fortunate yet. This spring, our executive gazed at the pending $15 peak congestion toll and rather than seeing less gridlock and a transformed transit system, saw a political abyss. Advocates and even her own staff tried to brace her for this “valley of political death” between congestion pricing’s initiation and its eventual acceptance. The warnings did no good. On June 5, she placed the tolls on “indefinite pause.”
There is talk that the governor will soon un-pause the tolls now that the suburban House races she feared would be swept up in a congestion pricing backlash are decided. But Gov. Hochul must move with urgency. The incoming president has made his distaste for the tolls abundantly clear. His return to power is less than 10 weeks away, with at least four of those weeks likely gobbled up by red tape. The plan’s logic that Hochul herself once articulated so well remains intact: better commutes and healthier, safer streets.
Hochul must act fast and trust the message from Washington State: with strong leadership, good policy and good politics can be one and the same.
The only way we’re going to seriously move away from fossil fuels is to significantly reduce the demand for fossil fuels.”
Michael Gerrard, director of the Sabin Center for Climate Change Law at Columbia University, quoted in Who Says You Can’t Live Off the Grid in Manhattan?, Nov. 10, a profile of Manhattan resident John Spodek, who is living off the power grid for a fourth consecutive year.
Another venue ripe for cost internalization: NYC food delivery
This post was published earlier today by the New York livable-streets site Streetsblog, under the headline Reining in Deliverista Distances is the Key to Safety. I’ve cross-posted it here because the proposal it conveys — a per-mile charge on app-based food deliveries — is an easily understandable illustration of the principle of “cost internalization” embodied by carbon taxing. Other recent illustrations are Strawberry Yields Forever, which reported on a grower-backed tax on groundwater in California’s Pajaro Valley; A Tantalizing New Front in Externality Pricing, about a proposed tax on helicopter noise; and periodic posts on the twists and turns in the long campaign to implement congestion pricing in New York City (here and here).
The text here duplicates the expositon in Streetsblog but near the end adds a paragraph contesting the widespread presumption that externality pricing necessarily injures marginalized groups (environmental justice communities, in the case of carbon pricing; food-delivery riders, in the case of the mileage charge outlined here).
— C.K., Nov 5, 2024.
Food deliveries in New York are spanning ever-longer distances. Before food apps, and before motorized bikes, deliveries came from nearby — from the local pizza parlor or neighborhood joint. Now deliveristas can be seen traversing the East River bridges or blasting up the Hudson River Greenway and the Central Park drives. When I ask a delivery rider at a red light how far he’s going, it’s often much more than a mile.
I’ll say it out loud: All that DMT — Deliverista Miles Traveled — has become a drag on other city cycling. It’s made the streets more chaotic and is stressing our bicycle lanes. Routine cycling maneuvers like sliding over in the bike lane or turning now require constant signaling and checking to avoid getting clocked from behind.

Photo: Josh Katz. Photo montage: Streetsblog.
Cars and trucks remain the greater danger, of course. But I find lumbering vehicles easier to anticipate and navigate around than darting mopeds or e-bikes. No, I’m not giving up cycling, but I’ve lost count of how many acquaintances have. The need for vigilance and the fear of being taken down in a crash became too great.
What the Comptroller Missed
City Comptroller Brad Lander last week issued a report, Strategic Plan for Street Safety in the Era of Micromobility, aimed at safeguarding workers and minimizing dangers to the public from the food-delivery industry.
As Streetsblog reported, Lander wants the city to exert authority over app companies like DoorDash and Uber Eats that process 90 percent or more of food deliveries in the five boroughs.
His suite of reforms is a start, especially jawboning officials to throttle the import and use of non-UL e-bike batteries like the ones that have sparked scores of serious fires.
But it misfires in pinning its street-safety aspirations on an empowered workforce and a semblance of enforcement by NYPD. The first can only go so far. The second appears to be a pipe dream. Lander also failed to include the lowest-hanging fruit for food-delivery safety: reining in deliverista miles traveled.
Reduce ‘Deliverista Miles Traveled’
Picture 40 percent of citywide food-delivery e-bike and moped miles eliminated. This would greatly enhance everyone’s safety, not just by directly cutting the sheer amount of fast and sometimes startling two-wheeling but also by dialing down street chaos and helping other cycling regain a footing in bike lanes and general traffic.
So how would that be accomplished? Mathematically, by shaving a mile from current deliveries covering a mile or more
According to a 2022 report from the Department of Consumer and Worker Protection, nearly two-thirds of the city’s app-based food-deliveries exceed one mile. (And nearly one-quarter of all deliveries extend for two miles or more.) Trimming a mile from those deliveries would reduce average delivery distances to 0.85 miles from the current 1.50 — a 43-percent reduction that I round down to 40 percent.
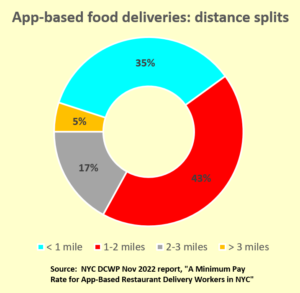
Nearly two-thirds of app-based food deliveries in New York City cover more than one mile, according to city data.
How can we make this shrinkage come about? By taxing app-based food deliveries for each mile beyond an initial free mile — as I outlined over a year-and-a-half ago in the Streetsblog piece, “Want Safe Batteries? Stop Pretending Food Delivery is Free.” The dollar-per-extra-mile fee would be doubled in Manhattan south of 60th Street, where food choices are abundant and foot traffic and road congestion are heaviest. The charges would be paid to the city by the app companies, who would tack it on the bill — creating an incentive for customers to order from eateries closer to home.
I can’t say conclusively that my dollar charge will bring about the envisioned 40-percent mileage reduction. I can confidently predict traffic reduction from congestion pricing because there is so much data about car trips, but food-delivery mileage charging is uncharted territory. The dollar charge for deliveries over a mile might have to be higher, or perhaps could be lower, but we’ll only know if the city conducts surveys or a simulation with randomly selected families spending down pre-filled accounts.
What I can say with confidence is that the delivery mileage charge would generate a ton of revenue — perhaps not my earlier estimated $100 million a year, but close to it. This pot could pay to swap out unsafe batteries and establish deliverista hubs. Some of these endeavors are already under way, happily, and the Comptroller’s plan would move things along, though on the taxpayer’s dime.
(Don’t) Walk on the Demand Side
The omission of a delivery-mileage charge from Lander’s report is a huge missed opportunity, but it wasn’t surprising. New York City’s leading cycling advocacy group, Transportation Alternatives, has yet to mention the idea in its policy papers. Perhaps in striving for solidarity with deliveristas, TA has short-shrifted the concerns of non-commercial cyclists — as Michele Herman, lead author of TA’s classic Bicycle Blueprint (PDF), argued this year in the Village Sun.
Lander’s omission also mirrors the tendency in environmentalist circles to turn a blind eye to the consumption aspect of so many policy questions. Climate protesters picket at banks that they say enable drilling and pipelines, but not at the gas stations at which motorists dutifully fill Big Oil’s coffers or at showrooms pimping the machines that actually combust the petrol. Similarly, the decade-long project to divest pension funds and universities from fossil fuels didn’t cut carbon extraction and burning one iota. It did, however, divert “YIMBY” activism that is vital to New York and other inherently low-carbon cities.
Climate may seem gargantuan vis-a-vis food delivery, but the parallels are powerful. Both spheres treat “demand” as inviolate. Just as suburban households are allowed McMansions and fleets of SUVs, we city dwellers are unquestioned on our right to order meals and treats anytime from anywhere.
Externality pricing is sidelined in both spheres as well. Just as carbon taxes would crush demand for coal, oil and gas, a dinner-delivery mileage charge would help rebalance ordering from faraway to nearby, adding a measure of predictability and orderliness — hence, safety — to city streets, far more than policing could ever do. Yet internalizing even a sliver of an activity’s harms into its price is out of bounds in contemporary discourse. Congestion pricing, whose supposedly “too high” $15 toll would have only offset one-sixth of a car trip’s congestion causation cost, got shelved lest drivers flip out.
And let’s not overlook the diktat granting veto power to potentially afflicted outgroups. In carbon pricing, those are primarily environmental justice communities deemed threatened by carbon emissions charging, even though economic mitigations are readily available and EJ communities suffer the greatest damage from extreme heat, flooding and other climate-wrought disasters.
Delivery-mileage pricing would directly affect the city’s 65,000 deliveristas, of course, but perhaps not adversely. Diminishing deliverista miles traveled wouldn’t equally diminish their employment and wages, since total deliveries would be largely unchanged. What would almost certainly fall is the terrible annual toll of a dozen or more fatal on-the-job crashes.
No sector of labor (or business) in New York City should be held sacrosanct. All should be governed for the greater good. Food delivery regulation should advance social safety without infringing on worker power. A mileage fee on food deliveries can serve workers as well as the society of which they’re a part. What are we waiting for?
- 1
- 2
- 3
- …
- 170
- Next Page »
