President Biden, in his inaugural address, Jan. 20.
Still they persist: 2/3 of voters in poll want carbon tax
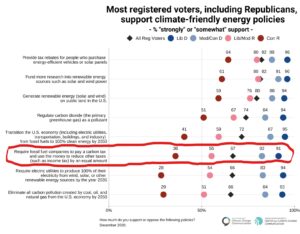
Two-thirds of registered U.S. voters support making fossil fuel companies pay a carbon tax, according to December 2020 climate polling by the Yale Program on Climate Communications released last week and reported in a Friday New York Times story, Survey Finds Majority of Voters Support Initiatives to Fight Climate Change.
The 67 percent support level for a carbon tax is in line with responses to the same question in earlier Yale polling in Nov. 2019 (69%) and April 2020 (68%), and with complementary goals like “require electric utilities to go all-renewable by 2035” and “eliminate all U.S. carbon pollution by 2050.”
Unsurprisingly, it’s well short of the 82 percent approval for perennial favorites like expanding clean-energy research and giving consumers tax rebates for purchasing high-mileage cars and solar panels; taxes, even on pollution, don’t sell as well as research and giveaways. On the other hand, the 67 percent pro-carbon tax rating far exceeded “increasing federal subsidies for renewable energy” (55%) and “decreasing subsidies for the fossil fuel industry (49%).”
The Yale survey polled 1,036 American adults aged 18 and older, of whom 949 are registered, and was conducted December 3-16, 2020.
The persistence of support for taxing carbon emissions is notable in light of increased antipathy toward carbon pricing from the political left.
Last month, the environmental and climate justice movement, acting from its misplaced conviction that California’s carbon cap-and-trade program is exacerbating pollution hotspots in minority communities, blocked the prospective nomination of the state’s air resources chief to head U.S. EPA. (The movement’s criticisms of cap-and-trade also extend to carbon taxing, as we detailed in this September post.)
More broadly, influential commentators like former Vox blogger David Roberts, who now publishes a climate newsletter called Volts, and UC-Santa Barbara political scientist Leah Stokes last year pronounced carbon taxing passé.
“The politics of carbon pricing just don’t seem to be going anywhere,” Roberts wrote last summer in At last, a climate policy platform that can unite the left, an ambitious post that propounded a three-pronged “Standards-Investment-Justice progressive rubric for climate policy. “Carbon pricing has been dethroned,” Roberts proclaimed, practically exulting over the idea that economists were having to cede the steering wheel to progressive activists, organized labor and environmental justice advocates.
Stokes is at the vanguard of rising young academics who disdain carbon taxing. “Carbon pricing has dominated conversations around climate policy for decades, but it is ineffective,” she wrote last September in The Trouble With Carbon Pricing, a lengthy essay in Boston Review. “Only a bold approach that centers politics can meet the problem at its scale.”
We rebutted Stokes and her co-author Matto Mildenberger in October. So did Joseph Majkut, climate policy director at the Niskanen Center, in an elegant blog post that we summarized here. Nevertheless, attacks on carbon pricing as ineffectual or unachievable (or both) continue to mount.
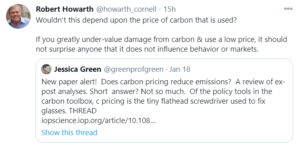
The latest entry, Does carbon pricing reduce emissions?, was just posted yesterday. The short answer, as Cornell Prof. Bob Howarth suggested on Twitter, is that low carbon pricing won’t cut emissions nearly as much as robust pricing.
CTC’s carbon-tax model indicates that a steadily rising carbon tax that reaches triple digits (i.e., $100 per ton of CO2) within a half-dozen years would, a decade hence, be reducing U.S. CO2 pollution by around a third. Needless to say, that’s not what the U.S. Chamber of Commerce had in mind recently when it added this deliberately non-specific language to its Position on Climate Change:
The Chamber supports a market-based approach to accelerate GHG [greenhouse gas] emissions reductions across the U.S. economy. We believe that durable climate policy must be made by Congress, and that it should encourage innovation and investment to ensure significant emissions reductions, while avoiding economic harm for businesses, consumers and disadvantaged communities. This policy should include well designed market mechanisms that are transparent and not distorted by overlapping regulations. U.S. climate policy should recognize the urgent need for action, while maintaining the national and international competitiveness of U.S. industry and ensuring consistency with free enterprise and free trade principles.
To be sure, the Yale survey question doesn’t specify a carbon tax amount, for good reasons. Even if that degree of detail were warranted, it seems impossible to fashion a question that could illuminate the level without biasing the outcome.
Consider these two possible survey questions:
- Do you support requiring fossil fuel companies to pay a carbon tax that could add nearly a dollar to the price of a gallon of gas?
- Do you support requiring fossil fuel companies to pay a carbon tax that would provide annual “dividends” of $1,800 for every U.S. resident 18 and older?
As you may have guessed, the carbon tax is the same in the two questions: $100 per ton of CO2. The framing, however, is quite different. We bet the second wording would poll 25 points higher than the first.
The Yale report, the latest in a series researched and written jointly with George Mason University’s Center for Climate Change Communication, has a wealth of polling results on nearly every conceivable aspect of climate change policy and politics. Such as this: About half of registered voters say the issue of global warming was important in determining their vote in 2020. (However, only 2% of voters ranked global warming as the single most important issue; for the rest it was “one of several important issues.”)
That’s on p. 33 of this intelligently conceived and artfully designed report, which you can download via this link.
Addendum, Jan. 21
Shortly after posting, we learned of a Jan. 12 report from Resources for the Future, The Climate Decade: Changing Attitudes on Three Continents (press release, here; full report, here), comparing 2019 vs. 2009 public opinion in Sweden, China, and the United States. Among the eight authors are the veteran RFF environmental economist Alan Krupnick and University of Gothenburg Professor of Environmental Economics Thomas Sterner.
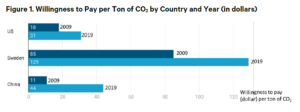
A big takeaway from the RFF report is an average “willingness to pay” to reduce CO2 emissions of $31 among U.S. respondents in 2019. Though that figure is less than the corresponding average in China and, especially, Sweden (see chart), it’s almost double the 2009 U.S. average of $18.
And while the $31 willingness to pay is far from the triple-digit carbon tax level CTC has been recommending for the past decade and longer, it almost certainly overstates the effective net cost of even a high carbon tax to U.S. consumers, on account of the ability of the carbon tax revenues to pay for social and economic benefits that would vastly lower the true net cost. Those benefits could be reduced payroll or income taxes (via a “tax swap”), lower economic and environmental costs from reduced use of fossil fuels, and/or direct payments to households via “carbon dividends.”
In short, a $31 per ton willingness by Americans to pay to reduce CO2 emissions actually signals support for high rates of carbon taxing.
Can You Live Large AND Green?
The War on Cars, a prophetic podcast “about the hundred years’ war between The Car and The City,” has built a loyal audience for its pithy explorations of U.S. car culture. Episode 51, Getting the Car Out of Carbon Emissions, which aired last November, caught the attention of Thomas Matte, MD, MPH, a New York City-based environmental health consultant and researcher whose work explores the interface between the urban physical environment and public health. Tom recently sent a letter to the podcast’s hosts. I’ve edited it for length and clarity. — C.K.
Dear War on Cars team:
Happy 2021. As one of my own New Year’s resolutions, I am belatedly reaching out to thank you for a great episode, Getting the Car Out of Carbon Emissions.
I’m a boomer-aged “car guy in recovery.” As an environmental health researcher and consultant, I’ve devoted a good deal of work to studying the effect of climate and air pollution on health in New York City. I appreciated your soliciting the perspective of another boomer and an unreformed car lover trying to be green (Motel 6 pitchman Tom Bodett) as well as a transportation thought leader (Andrew Salzberg) who understands the limits of private electric vehicles for decarbonizing transportation.
I’d like to share some suggestions for themes you could explore in future episodes, possibly circling back to Mr. Bodett and Bill McKibben, another rural Vermonter you recently interviewed.
1. The fossil fuel inputs to “green technology” embed substantial carbon emissions.
From listening to Mr. Bodett, one might think his Tesla, solar panels, electric heat pump and grid connections all grow on trees. In fact, the embedded carbon emissions from manufacturing EVs are a substantial share of life cycle emissions and exceed the embedded emissions for conventional vehicles, mostly on account of the batteries. Similarly, the plastics and metals used in solar and wind generating equipment and electricity-powered heating, cooling and other appliances are currently manufactured with considerable (and difficult-to-decarbonize) energy inputs.
Many components are manufactured in China, where industry is more carbon-intensive than in the U.S. Inputs of water, land and other finite resources as well as impacts of recycling or disposing of batteries and other components at scale also need to be considered.
This doesn’t obviate the benefits of EVs and renewable energy. Nevertheless, as Mr. Salzberg points out, the more energy and resources are devoted to privately owned EVs — especially oversized ones built for speeding and off-road use — the harder it is to decarbonize the economy.
2. Private-vehicle-enabled country living is resource-intensive and rife with environmental externalities.
The low population density of Mr. Bodett’s southern Vermont home “town” of Dummerston means that land – a finite resource – is used very inefficiently there. While I am sure things look green and natural when he looks out the window, the yards, homes, septic systems, wells, pools, roads and other infrastructure and their maintenance intrude and impact on the forest, fields and habitats that would otherwise have developed there when farming declined and migrated from New England. The result is less truly natural land for ecosystem services and less unspoiled forest for threatened species and hikers to enjoy.
If, for example, Dummerston had developed with the more compact urban form of nearby Brattleboro, the same population could live on much less land, leaving around 16,000 acres undeveloped, by my estimate. Or consider this thought experiment: what would happen if the population of Inwood in northern Manhattan, where I live, packed up, moved, purchased and developed land in rural areas at the density of Dummerston? More than 600,000 rural acres would be impacted. So, by living in urban Inwood, rather than fleeing to “greener” country living, Inwood residents are conserving more than all of the land purchased at considerable cost and protected to date by the Vermont Land Trust.
3. Low-density rural settlement creates barriers to climate change mitigation and adaptation.
Low-density development isn’t just more carbon intensive on a per capita basis, as demonstrated in this seminal 2006 analysis published by the American Society of Civil Engineers. It also makes it harder to decarbonize the energy supply by scattering people across the land. As a result, more people live in the sight lines of potential wind energy projects, worsening the political environment for wind energy. Spreading development into the wilderness-urban interface also amplifies climate-driven risks to life and limb from vector-borne illness and wildfires, as we have seen recently across the American West.
4. Low-density rural settlements don’t foster equity and health.
Dummerston is less demographically diverse than even nearby Brattleboro and of course much less diverse than many larger towns and urban settlements. Like many rural Vermont communities, it is too sparsely populated to support even limited bus transit. Compared to more-densely developed communities, Dummerston offers fewer opportunities for living, working, accessing services and upward economic mobility for socioeconomically disadvantaged groups, especially if they cannot afford private motor vehicles.
Vermont’s characteristic rural, low-density development also limits the potential for the healthiest way of reducing transportation greenhouse gas emissions: investments in public transit and active-mobility (walking and biking) infrastructure. Vermont’s car-dependent commuting mode split has barely budged in decades, with around 75 percent of trips in single-occupant vehicles (driving alone) and less than 2 percent via transit or cycling. Admittedly, for those who can afford the resources and leisure, some of the sedentary time behind the wheel might be partially offset by physical activity from hikes, chopping wood for heat, or, in Tom Bodett’s case, laps in the in-ground pool.
Is affluent and green Vermont an oxymoron?
This isn’t to say that no one should live in rural areas or that everyone should move to a city. But too often, natural backdrops create an illusion of living in harmony with nature. Electric vehicles and rooftop or backyard solar panels have their place, of course, but Mr. Bodett’s extravagant lifestyle cannot be scaled up in a green or sustainable way.
To be sure, Tom need not move to Manhattan to live more sustainably. He could decamp to a smaller lot in a walkable location in Brattleboro. The walkscore.com site shows several, and more may be in store; Vermont’s Department of Housing and Community Development last summer posted a detailed guide for zoning reform to expand housing and create opportunities to live in compact, walkable neighborhoods like those found in some of the State’s historic villages and downtowns. Mr. Bodett could move to town, trade in his Tesla for a Nissan Leaf and an e-bike, and could close up his Dummerston estate — filling in the pool and letting the forest reclaim all but the solar array and the road needed to service it.
By doing this, Tom would allow more of his renewable solar energy production to help decarbonize the grid for his Vermont neighbors. Of course, Mr. Bodett is wealthy enough to live anywhere he chooses, but that doesn’t mean his well-intentioned but faux green lifestyle should be promoted or subsidized — especially as we learn more about the social and environmental costs to obtain the resources that green technologies require.
Sure, Tom, go ahead and “leave the light on” for us. Just not so many.
Dogmatism on Carbon Pricing Mustn’t Derail Climate Progress
Note: A new (March 2021) CTC page, Carbon Pricing and Environmental Justice, summarizes this post and its Sept. 2020 predecessor, Environmental Justice, Borne Aloft by Carbon Pricing, and embeds them in a larger narrative about the environmental justice movement’s increasing turn against carbon pricing.
Mary Nichols’ candidacy to lead the US Environmental Protection Agency is over. Not so, the need to grapple with the profound mistrust of carbon pricing felt by many advocates for environmental justice.
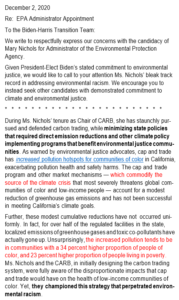
Nichols, long-time California clean-air chief, was considered “a lock” to head the EPA, according to the New York Times, until 70 environmental justice and allied groups sent a strongly worded letter, excerpted at left, to the Biden-Harris transition team opposing her nomination. The new administration’s selection of North Carolina environmental quality secretary Michael Regan for the position was announced last week.
Signatories (download the letter here, pdf) included national organizations Friends of the Earth, Greenpeace, Food & Water Watch and Oil Change International, along with dozens of California groups and the umbrella California Environmental Justice Alliance.
A principal charge in the letter, and the one singled out by the Times and in other media accounts, was a claim that the carbon cap-and-trade program overseen by Nichols and the California Air Resources Board “perpetrates environmental racism [by] increas[ing] pollution hotspots for communities of color in California.”
That charge may be seen as a culmination of the deep suspicion with which many environmental justice advocates regard pollution taxes or cap-and-trade schemes (the two are often termed “market measures”) intended to cut carbon emissions.
I did my own grappling with this matter in a lengthy post here in September. I noted inter alia that “many activists recoil from carbon pricing’s implicit acquiescence to capitalist means of exchange that [appear to] commodify pollution” — language similar to the EJ letter’s charge that “market mechanisms … commodify the source of the climate crisis.”
Ironically, those who, like me, train an economic lens on the climate crisis regard the failure to price carbon emissions as a source of the climate crisis. And not just economists but the entire environmental community is united in demanding elimination of fossil fuel subsidies. Yet the ability to dump carbon pollution into the atmosphere for free is the biggest subsidy of all, and carbon taxes (or “charges”) uniquely diminish that subsidy.
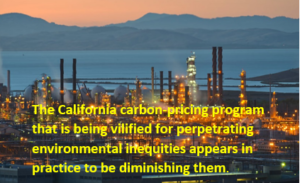
Nevertheless, the sharper irony, addressed here, is that the cap-and-trade program that is being vilified for perpetrating environmental inequities appears in practice to be diminishing them.
Environmental Inequity and Pollution Hotspots
As recently as a decade ago, ground-level concentrations of deadly carbon “co-pollutants” — toxic particles and gaseous oxides — issued from industrial smokestacks in California were three to four times higher in disadvantaged communities than in more affluent and predominantly white locales. That result was derived in an analysis published earlier this year by two U-C Santa Barbara economists, ratifying what environmental justice campaigners from these communities have always understood.
Compounding this long-standing health assault, an early cap-and-trade program meant to curb smog in California (called Reclaim) was riven with escape clauses that, it is said, emboldened increases in pollution dumping onto minority communities from an enormous oil refinery — the state’s second largest — in Richmond, near San Francisco. The conviction was soon born that pricing of pollution, whether auctioned to polluters as tradeable emission permits (cap-and-trade) or charged directly (via pollution taxes), could never mitigate pollution inequities afflicting historically-burdened communities of color.
This belief grew and intensified across California, fueled by intersecting political and social currents and by research suggesting that a newer, more ambitious and less porous statewide carbon cap-and-trade program legislated in 2006 and put in place in 2013 by the California Air Resources Board was likewise concentrating emissions in minority communities. (A 2019 paper, California Climate Policies Serving Climate Justice, by Univ. of San Francisco Law Professor Alice Kaswan, is a useful guide to the state’s many laws addressing carbon emissions and environmental injustice.)
Must carbon pricing worsen hotspots?
The specter of “hotspots” is paramount in the Dec. 2 EJ letter and prominent in environmental justice expressions on pollution pricing. Yet the idea that polluters respond to charging for pollution by perpetuating or, worse, exacerbating toxic emissions in poor communities runs counter to almost everything we know (or believe we know) about how polluting enterprises actually operate.
A carbon tax, by its nature, exacts a cost for every missed opportunity to reduce carbon emissions. Carbon pricing makes every means — and there are literally billions at hand — of reducing carbon emissions more profitable, which is why devotees of carbon taxes find them so enticing.
The price incentive, we believe, gives individuals and especially companies new cost-effective means to pare their use of carbon fuels. (The same is true for carbon cap-and-trade programs, although there the cost is paid, somewhat indirectly, via the polluting company’s purchase of emission permits, and the price signal is found in the carbon-permit market.) Accordingly, a company that deliberately perpetuated toxic hot spots in disadvantaged communities would weaken its bottom line.
Consider an oil company that operates 10 refineries — 5 in minority communities, 5 in white locales. Under a carbon price, every new piece of equipment or procedure that reduces carbon emissions at any of the 10 reduces the company’s carbon tax tab (or its cap-and-trade expenses).
All 10 refineries will almost certainly undergo some change to lower their emissions. Logistical considerations or racial favoritism might conceivably lead the company to concentrate more of its reduction effort at its 5 white sites. But it strains credulity to posit that the minority sites will take on more emissions on account of the carbon price.
The reason? Carbon pricing is a unitary policy that applies equally to all emissions. Charging for emissions creates opportunities to cut emissions everywhere, simultaneously. The choice presented to headquarters isn’t to pit potential reductions from Refineries 1-5 against reductions from Refineries 6-10, but to max out on the new cost-cutting opportunities that the carbon price presents at Refineries 1 through 10 .
This schematic suggests that even community-neutral pricing policies — ones that lower total emissions without regard to where — will benefit disadvantaged communities in health terms. That is true even if the relative bias of disproportionate burdens on those communities isn’t specifically targeted, whether in the pricing design or in the use of the carbon-pricing revenues.
Keep in mind that the refineries or other large emitters that are most cost-effective to upgrade or downsize because of the carbon price will be those with the oldest, most-polluting equipment. To the extent that these are in poorer communities — a syndrome that the environmental justice movement has documented for decades — the emission reductions will be concentrated there as well.
There is also the mathematical fact that equal percentage reductions across the board will bring the greatest absolute emission reductions where the baseline emissions are highest. If polluters are spewing 200 tons of pollution on your community but only 100 tons on mine, a 25% reduction everywhere will cut emissions in your back yard by 50 tons, vs. 25 tons in mine.
For the inequitable historic differential in pollution exposures to widen, there would have to be grossly lesser emission percentage reductions in minority areas. In the example above, the decrease in emissions in those areas would have to be held to just 25% while emissions elsewhere fell 50% or more.
A few such examples can probably be found in California, among the 300-plus emitters large enough to be covered by the state’s carbon cap-and-trade program. But so long as the overall cap is tightened each year while “offsets” and other loopholes are kept to a minimum, any increases will be far outweighed by reductions in other low-income communities of color.
A Startling Finding about California’s Carbon Cap-and-Trade Program
In early August, I learned of a new academic paper that, in its elegance and reach, appeared capable of singlehandedly untethering carbon pricing from the charge of environmental injustice. The paper is the one mentioned up front that found that just a decade ago, as a baseline, California’s disadvantaged communities suffered from far larger concentrations of carbon “co-pollutants” from industrial smokestacks, compared to whiter and more prosperous locales.
The person who collegially notified me of the paper was Lara Cushing, an epidemiologist (MA) and energy policy specialist (PhD). It was Prof. Cushing’s team whose research was cited in the letter to the Biden-Harris team charging that California’s carbon cap-and-trade program “perpetrates environmental racism.”
During the rest of August and most of September I pored over the academic paper, which was titled, “Do Environmental Markets Cause Environmental Injustice? Evidence from California’s Carbon Market.” I corresponded with its authors, members of U-C Santa Barbara’s economics department: PhD candidate Danae Hernandez-Cortes and Associate Prof. Kyle C. Meng. Their paper was complex and bursting with implications, and I wanted to be certain I understood it fully before writing it up. I circulated a draft story to a few environment-oriented outlets for publication or a news exclusive, eventually posting it myself to the Carbon Tax Center website on Sept. 28 as Environmental Justice, Borne Aloft by Carbon Pricing.
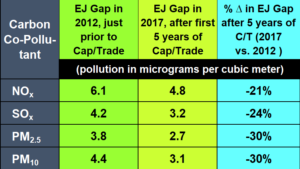
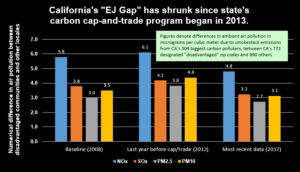
Hernandez-Cortes and Meng’s key finding, I explained, was this: From 2012 to 2017, the pollution disparity between disadvantaged and other communities in California fell an estimated 30 percent for particulates, 21 percent for nitrogen oxides and 24 percent for sulfur oxides. Moreover, the 21-30 percent drops in the state’s “EJ gap,” as they termed the disparity, was not merely concurrent with the cap-and-trade program, which CARB put into effect in 2013; it was “due to the policy” itself, according to the authors.
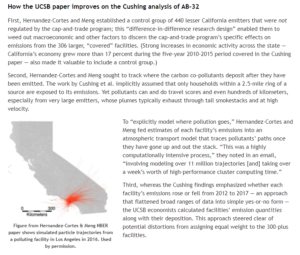
This finding differed diametrically from the conclusions of Prof. Cushing and her colleagues, and I was obliged to explain why. The account from my post is shown in the sidebar and summarized below:
- To weed out macroeconomic and other extraneous factors and discern the cap-and-trade program’s specific effects on its “covered” facilities, Hernandez-Cortes and Meng included a comparison group of unregulated California emitters.
- Hernandez-Cortes and Meng traced the atmospheric paths taken by the pollutants once they left the smokestacks, via modeling, rather than assuming they landed in narrow bands nearby.
- Hernandez-Cortes and Meng based their before-and-after calculations on each facility’s actual emissions — a richer and more accurate approach than the earlier work’s up-or-down formulation.
Reactions to the Hernandez-Cortes – Meng Findings
My post highlighting the Hernandez-Cortes – Meng findings drew little comment (none from the environmental justice campaigners to whom I reached out) and very little press. The paper’s two mentions in the green press — in an October article in Grist, Cap and Trade-Offs, and in a November story in Yes! magazine, Can California’s Cap and Trade Actually Address Environmental Justice? — were cursory and largely dismissive.
For example, the Yes! article said that the 20% to 30% narrowing of the EJ gap applied only “in the areas where facilities were covered by the program,” whereas Hernandez-Cortes and Meng actually calculated the reductions across all of California’s 1,712 populated zip codes. The Grist story obfuscated Hernandez-Cortes and Meng’s statistically significant modeling of smokestack dispersions as reflecting only “a spread of outcomes of various likelihoods” — whatever that means.
One could almost intuit a wish to cling to the Cushing team’s negative conclusion about cap-and-trade’s outcomes, and thus to downplay Hernandez-Cortes and Meng’s ingenious analysis that had apparently upended it.
Finally, in late November, a substantive critique of the Hernandez-Cortes – Meng analysis appeared. It was posted by Danny Cullenward, a lecturer and affiliate fellow at Stanford Law School, and Katie Valenzuela, who formerly was policy and political director for the California Environmental Justice Alliance and co-chair of California’s AB 32 Environmental Justice Advisory Committee (AB 32 is the state’s 2006 umbrella climate law).
Yet the Cullenward-Valenzuela criticisms of Hernandez-Cortes – Meng appear to point to imperfections, not fatal flaws.
To wit: Hernandez-Cortes and Meng employed zip codes and not finer-grained census codes to compare EJ neighborhoods with other locales. Hernandez-Cortes – Meng drew smokestack data from the state’s 35 different regional air districts that, they say, “use 35 different methods for data collection.” Hernandez-Cortes and Meng didn’t adjust for possible confounding effects from California’s Low Carbon Fuel Standard, a companion climate measure that took effect during the period covered in their cap-and-trade analysis.
Notably, however, neither Cullenward-Valenzuela nor anyone else writing from an environmental justice perspective criticized the Cushing team’s analysis — the one bolstering the belief that the cap-and-trade program has deepened environmental inequities — for these same failings, let alone its more consequential shortcomings I enumerated in the preceding section. Nor did Cullenward and Valenzuela attempt to quantify how much, if at all, remedying the asserted shortcomings in the Hernandez-Cortes and Meng paper would weaken their findings.
Perhaps the weightiest criticism of Hernandez-Cortes – Meng from Cullenward and Valenzuela is their last, under the heading, “The question is not cap-and-trade versus nothing”:
If California had chosen a path of more prescriptive, direct emissions reductions … we would likely be seeing far more emissions reductions … and far more improvements for environmental justice communities than we’re seeing under the cap-and-trade program today. To say [the cap-and-trade program is] better than nothing ignores the fact that adopting a weak cap-and-trade program has led to prolonged and higher emissions in environmental justice communities than if California had adopted a stringent carbon pricing policy or relied instead on non-market mechanisms that would have been targeted at the pollution reductions our communities need.
That claim may well be true. It certainly resonates with me, an advocate since the late 1980s of straight-up carbon taxing rather than oblique and often loophole-plagued cap-and-trade approaches. But that’s not the question that Hernandez-Cortes and Meng tackled in their study, which was: On a statewide basis, has California’s cap-and-trade program widened or narrowed environmental inequities?
Though California EJ advocates insist that the cap-and-trade program has widened environmental inequities, no one has effectively rebutted the evidence marshaled by Hernandez-Cortes and Meng that it has actually narrowed them.
Possible Trouble Ahead
The scant attention accorded the Hernandez-Cortes – Meng paper has largely sidelined its meticulous and virtuosic treatment of the impact of California’s cap-and-trade program on environmental inequities. A result has been to let stand the accusation that the program’s sponsoring agency, the California Air Resources Board, has “perpetrated environmental racism.”
My concern here is not that that charge helped block CARB’s Mary Nichols from heading EPA, but with the possibility that its uncritical acceptance may impact national environmental and climate policies going forward.
The idea that carbon pricing cannot serve environmental justice may have been justified by systemic oppression, and it dovetails nicely with certain critiques of capitalism as being a willing handmaiden of inequity. But in its largest empirical test to date in the United States, that proposition has been shown highly questionable. Now, judging by its impact on Nichols, it threatens to block carbon pricing measures from consideration by the incoming Biden administration.
Getting meaningful climate legislation through a divided Congress will be difficult under any circumstances. The temptation will now be strong to jettison measures that might be opposed by advocates for racial justice and others on the left. Another New York Times story this month, this one showcasing president-elect Biden’s choices of Janet Yellen and Brian Deese for Treasury secretary and National Economic Council director, noted that carbon pricing “is fiercely opposed by both conservatives and some liberal groups.”
Carbon pricing, whether rendered through tradeable emission permits or straight up via carbon taxes, faces hurdles galore. Saddling it with unfounded criticisms, notwithstanding their deep wellsprings, appears more likely to compound environmental injustice rather than help overcome it.
New York, U.S. Must Reverse the Charges on Diesel Tampering
[A similar version of this post was published earlier today in Streetsblog.]
If New York State were as diligent as California at preventing emissions tampering by owners of diesel pickup trucks, the resulting health gains could exceed $120 million.
Nationwide, bringing all 50 states up to California’s tampering-prevention level would eliminate around $10 billion in future disease and death costs caused by these gross emitters.
Both figures correspond to tailpipe pollution prevented over the remaining lives of tampered trucks already in use. The savings from thwarting motorists from tampering with new vehicles would be additional.
These figures denote the economic value of the reduced asthma attacks, worker and student sick days, pulmonary hospitalizations and premature deaths from compelling 80 to 85 percent of owners of “Class 2b or 3” (8,000-14,000 lb) diesel pickups to unplug software “tuners” and after-market engine devices that are causing their vehicles to out-spew unmodified diesel pickup trucks by factors of 30 to 300 for nitrogen oxides and 15 to 40 for particulates, according to an EPA report released last month.
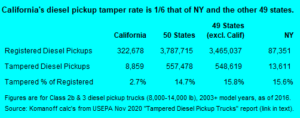
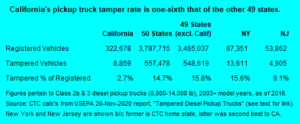
The figures arise from this finding from my Dec. 1 post, “Takeaways from America’s Diesel Pickup Pollution Disaster”: the practice of incapacitating diesel pickup pollution controls to boost “performance” is only one-sixth as widespread in California as it is nationwide: 27 per 1,000 pickups in the Golden State vs. 147 for the country as a whole, 158 per 1,000 for the other 49 states, and 156 per 1,000 in New York State.
Simple ratios tell us that pushing New York’s 15.6-percent tamper rate down to California’s 2.7 percent would cause 11,200 of the state’s 13,600 super-emitter pickups to regain their assembly-line emissions quality.
Calculations based on the EPA report reveal that over its anticipated remaining service life, each modified diesel pickup will blast out more than a ton of extra nitrogen oxide gases (NOx) and nearly 20 pounds of extra particulate matter, compared to an undisturbed vehicle. Each tailpipe hit comes with high costs to our health: around $5 per extra pound of NOx and $40 for PM in New York State, slightly less for the U.S. as a whole.
(I pulled these per-pound costs from a classic workup of the health costs of motor-vehicle-related air pollution: the eponymous 1999 paper by the externality-cost savants Don McCubbin and Mark Delucchi, published in the Journal of Transport Economics and Policy and archived by the London School of Economics. I did some tweaks, inflating the 1991 per-kg costs in the paper’s Table 5 to 2020 dollars, converting from kg to lb, weighting the “US” and “urban” cost rates ¾ and ¼ in New York State but all “US” for the national calculations, averaging “low” and high” costs geometrically rather than arithmetically to temper the highs, and excluding “upstream” and “road dust” costs. And I tacked on an extra 15-20 percent to reflect epidemiologists’ increased understanding in the past two decades of air pollution’s role in strokes, type 2 diabetes, and a range of neonatal diseases related to low birth weight and preterm birth.)
Multiply those dollar rates by the excess emissions in pounds per pickup, and the extra air pollution damages to residents of New York State compute to $11,000 per offending vehicle before it finally hits the scrap heap (more for vehicles driven in NYC and other populated areas, less in, say, the sparse Adirondacks). Ecosystem costs are not included.
Now factor the $11,000 per-vehicle damages by the EPA’s count of 13,600 tampered pickups in New York; the result, $150 million, is the monetary equivalent of the damage they will wreak on New Yorkers’ lives and lungs.
The more salient figure for policy, however, is obtained by applying the $11,000 per-vehicle damages to the 11,200 pickups — five-sixths of the state total — whose emissions would revert to normal if New York instituted anti-tampering policies that matched California’s in efficacy. That figure, around $125 million, denotes the future health damages that New York could eradicate with California-style pursuit of diesel pickup tampering.
How much would this cost? Probably just a few million dollars a year. Officials at California’s Air Resources Board (CARB), which oversee almost four times as many diesel pickups as New York, told me last week that they run their anti-tampering program on $3 to $4 million a year. Even a decade’s worth of those expenditures by New York State would be more than paid back in the health benefits from the reduced emissions.
What’s the best way for states like New York to get their anti-tampering, clean-air game on?
They could go it alone. But no state has an analogue to CARB, the world’s premier anti-vehicle pollution agency since its founding in 1967. (The link, a CARB web page that informs vehicle owners and dealers which after-market products are legal and which are not, is one among numerous examples of the agency’s problem-solving approach.)
New York’s car and truck inspection system is jointly managed by the Departments of Environmental Conservation and Motor Vehicles. As safer-streets advocates in New York know full well, the DMV habitually ignores entreaties to use its licensing powers to hold habitual dangerous drivers accountable. There’s no reason to believe DMV has the oomph to mount and manage the comprehensive anti-tampering programs that have proven so effective in California. (We asked DMV on Friday why New York’s tampering rate is six times California’s; we’ll add the agency’s response, if we hear back.)
A more productive approach may be for New York to team with other states to follow California’s lead and shut down the aftermarket supply chain of manufacturers, distributors and dealers that sell the emission-control defeat-devices and programs. This effort could be led by state attorneys general like New York’s Letitia James, who have proven to be more pro-active than governors or legislatures and who frequently partner in litigation to protect air and water quality. They could start by suing Amazon to stop the sale of pollution defeat devices.
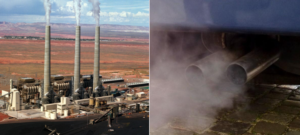
Now, about our earlier side-by-side pics of a coal-fired power plant and a spewing diesel pickup: a friend of Carbon Tax Center asked us how the “excess” particulate emissions from all tampered U.S. pickups compare with emissions from the coal-fired generating stations in the Grand Canyon airshed. We ran the numbers and found that EPA’s estimate of 5,407 tons of PM over the remaining lives of the tampered vehicles was eerily close to our estimate of 4,900 annual tons from one of the three 750-MW units at the now retired Navajo Generation Station in Page, AZ, 60 air miles from the canyon’s north rim. (We assumed a 75% capacity factor, 99%-effective particulate removal, 15% ash content of the coal, and a 50% average increase in molecular weight from oxidizing the ash in combustion.)
Another way to view that finding is that it takes just 700 or so tampered pickups to produce one megawatt’s worth of particulate emissions from a reasonably well-controlled coal-fired power plant (with the caveat that the pickup pollution is estimated over the vehicles’ expected remaining lives, vs. annual emissions for the power plant).
Rolling coal, indeed! Nevertheless, while monster-truck pro-Trump road rallies may look scary, they’re easy to shrug off. Not so, pulmonary stress from tampered emission controls. California has shown that it’s possible to root out gratuitously dirty diesels. New York and other states should get on it, now.
Takeaways from America’s Diesel Pickup Pollution Disaster
[A similar version of this post was published earlier today in Streetsblog.]
Combustion vehicles invite law-breaking. Petro-masculinity is deep-seated in American culture. But California, at least, has vanquished emissions tampering.
These are takeaways from the explosive New York Times story last week reporting that an estimated 550,000 U.S. diesel pickup trucks are being driven with compromised anti-pollution devices, making them super-emitters.
Takeaway #1: eliminating America’s petroleum-fueled vehicles is urgent business.
For decades, every gasoline or diesel powered sedan, SUV, pickup and motorcycle sold in the 50 states has come with emission-reducing filters, catalysts and control systems. And for just about every make and model there’s an aftermarket product that lets the owner weaken these systems or disable them altogether.
These nefarious products range from software patches called “tuners” that reprogram the software that calibrates engine functioning, to “straight pipes” that bypass exhaust gas controls and, as one purveyor puts it, “allow a car engine to flex its muscles and to make as much noise as it wants.” Purchasing and installing these devices isn’t rocket science, as evidenced by the fact that nearly 15 percent of “Class 2b and 3” diesel pickups on the road today — vehicles weighing 8,000 to 14,000 pounds — have missing or inactivated emission controls, according to the federal Environmental Protection Agency.
The result is massive excess per-vehicle emissions of on-road vehicles’ two most health-damaging pollutants: 30 to 300 times higher emissions of nitrogen oxides (NOx) and 15 to 40 times more particulate matter, according to a five-year EPA research project uncovered last week by Times environmental reporter Coral Davenport. (Her sleuthing may have been aided by rising EPA staff resistance to Trump administration regulatory teardowns in anticipation of the pending presidential changeover.)
The rampant lawbreaking goes far beyond even those figures, since EPA’s Office of Civil Enforcement examined only diesel pickups. According to Davenport, similar defeat devices, which let drivers accelerate more quickly and loudly, “almost certainly have been installed in millions of other vehicles.”
California has proven that robust enforcement can drastically shrink the problem. But a more surefire way to plug this gaping leak in America’s tailpipe regulatory regime is to do away with tailpipes altogether by replacing combustion with electricity, which effectively substitutes hundreds of closely-monitored (and, increasingly, zero-carbon) power plants for millions of wrench-heads.
The danger of ‘aggro bros’
The second takeaway has to do with the veneration of torque and thrust that impels legions of our countrymen (yes, they’re mostly male) to sideline four decades of hard-won antipollution progress and remake their vehicles as 1980s-era gross emitters.
The charitable interpretation is that, save for a relative handful of “Rolling Coal” lunatics, these engine offenders may not fully grasp how baldly their aftermarket escapades are magnifying their vehicles’ emissions. However, a more compelling interpretation employs the lens of “petro-masculinity”; that’s Virginia Tech political-science professor Cara Daggett’s term for the “toxic combination of climate denial, racism and misogyny” that she sees emerging in response to climate change.
Obnoxious Trump supporters in New York shut down Mario Cuomo bridge pic.twitter.com/2HPHpz3CAS
— Fifty Shades of Whey (@davenewworld_2) November 1, 2020
“The concept of petro-masculinity suggests that fossil fuels mean more than profit,” Daggett wrote in her groundbreaking 2018 article, “Petro-masculinity: Fossil Fuels and Authoritarian Desire.” “Fossil fuels also contribute to making identities,” she mused, and “fossil fuel use can function as a violent compensatory practice in reaction to gender and climate trouble.” (My colleagues at Streetsblog USA also raised this issue earlier this year.)
A month ago, after that bizarro pre-election weekend when Trump thugs in bulked-up pickups bullied a Biden campaign bus off a Dallas freeway and wilded mid-span on New York’s Mario Cuomo (formerly Tappan Zee) Bridge, Earther columnist Brian Kahn summoned Daggett’s petro-masculinity:
Highways full of gas-guzzling trucks and SUVs are a distillation of so much of the past four years, and indeed the entire fight over climate action. Vehicles have become one of the status symbols that define where you fit in the culture war, whether it’s a big, strong truck, a hybrid Prius, or a bike. This weekend’s trucks clogging the highway and needlessly polluting are a big middle finger to climate activists and others trying to draw down emissions to protect their and future generations.
Perhaps when Trump is shown the door his fans will torch the factories making N-95 masks. That’ll show the libs!
Some good news from the Golden State
Takeaway #3 is — get ready — good news: California, the state that for the past half-century has defined effective environmental governance, has held vehicle emissions tampering to a minimum.
State data breakdowns in the EPA report indicate that compromised diesel pickup pollution systems are only one-sixth as widespread in California as in the rest of the country: 27 per 1,000 pickups in the Golden State vs. 158 per 1,000 for the other 49 states. (The next best rate after California, New Jersey’s 91 tampered pickups per 1,000, is more than three times California’s rate.)
Expressed differently, if emissions tampering in California were as prevalent as in the rest of the U.S., the state would have 51,000 diesel pickup super-spreaders rather than the roughly 9,000 estimated by EPA. The effect would be stark: more asthma attacks, more worker and student sick days, more pulmonary hospitalizations, and more premature deaths across the nation’s most populous state.
What’s California’s secret sauce for preventing diesel tampering? It’s actually two sauces: an upstream part that bars every link in the aftermarket supply chain — manufacturers, distributors, dealers, installers, repair shops and vehicle owners — from selling or installing a long list of proscribed emissions tampering tuners and equipment. (This California Air Resources Board enforcement advisory has details.) And a downstream part that subjects Class 2b and 3 diesel trucks to annual Smog Checks that visually inspect the vehicle’s On Board Diagnostic emission control governor and also keep a lookout for possible aftermarket reprogramming or removal of exhaust components.
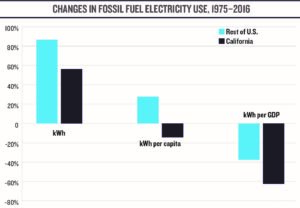
Since 2012, the California Air Resources Board has enforced 53 cases, collecting $17.5 million in fines, almost entirely from businesses, according to an agency spokesperson I contacted for this story. It’s the same Golden State diligence I reported last year in “California Stars,” a report concluding that since the 1970s the state had surpassed the rest of the country by 25 percent in its uptake of energy efficiency, solar panels and wind turbines. And again this year, when two U-C Santa Barbara economists found that the state’s carbon cap-and-trade program was appreciably narrowing the “environmental justice gap” between rich white and poor Black and brown neighborhoods and communities, as I reported for the Carbon Tax Center.
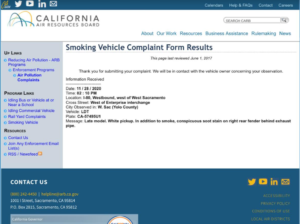
CARB even maintains a hot line to report smoking vehicles. It cleans the air AND signifies state government’s commitment to hold motoring offenders accountable.
Law and culture are intertwined. Maybe by now there’s something baked into the state’s culture that bends stakeholders — even grease monkeys and aggro drivers — toward adherence with laws that protect lungs and produce blue skies.
Carbon pricing is key. All firms across our economy need to pay the price of polluting the planet.”
Janet Yellen, chairman of the U.S. Federal Reserve, 2014-2018, and president-elect Biden’s apparent choice for Treasury Secretary, quoted in The 41 Things Biden Should Do First on Climate Change, Bloomberg Green, Nov. 11, 2020.
The time of fossil fuel subsidies is over. Coal must be phased out. Carbon should be given a price. 2021 must be the year of a great leap towards carbon neutrality.”
UN Secretary-General António Guterres, via Twitter, Nov. 16.
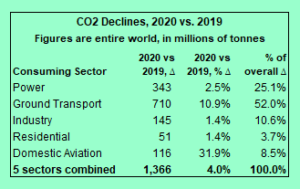
Downturn in U.S. driving led 2020 global CO2 decline
[Note: A Feb. 23 update to this post with full-year 2020 vs. 2019 data for all eight world sectors revised, downward, the shrinkage of U.S. ground transport carbon emissions that we had highlighted here. That revision is substantial.]
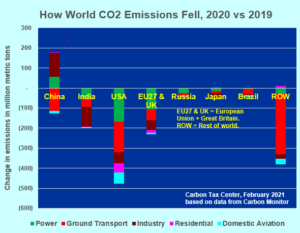
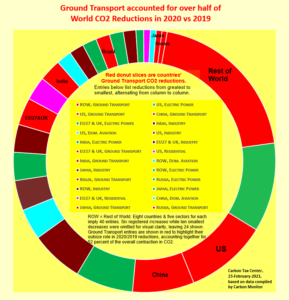
The world’s emissions of carbon dioxide from burning fossil fuels diminished by more than 1.6 billion metric tons in the first three quarters of 2020 from the same period in 2019, a decline of 6.3 percent. Fully one-fifth of the decline, 320 million tonnes, was due to the nearly 25 percent drop in ground transport in the United States, according to data compiled and made available this week by Carbon Monitor, an international collaboration of energy and climate specialists providing regularly updated, rigorous estimates of daily CO2 emissions.
The Carbon Monitor data, downloaded and reshuffled by Carbon Tax Center, reveal the sources and extent of the drop of emissions during the COVID-19 pandemic. In both absolute and percentage terms, the total U.S. year-on-year January-September decline — 514 million metric tons and 13.1 percent — outpaced the world’s other major emitting nations and regions. The percentage drop of 13.1 percent through September more or less guarantees that U.S. carbon emissions for all of 2020 will fall below year-2019 emissions by double digits.
Close behind the United States in percentage terms of decline were Brazil, with a 12.9 percent drop from 2019 to 2020, and India with 11.7 percent. But because U.S. emissions are so large in absolute terms, the tonnage drop here dwarfed that of India (225 million tonnes) and Brazil (44 million tonnes).
China was far down the ranks of emission reducers. From the first three quarters of 2019 to the same period in 2020, its emissions shrank by just 109 million tonnes, a decline of only 1.4 percent. Although China’s ground transport carbon emissions did fall by 15 percent — just short of the rest of the world’s 16 percent decline for that category — none of the country’s other major emitting sectors showed pronounced declines, except for domestic aviation, which fell by 26 percent. Omitting China from the calculations, world CO2 emissions fell by 8.4 percent over the three-quarter periods, though admittedly that construct is a bit like considering recent U.S. presidential popular votes without California.
Nearly half of the global CO2 decline — 787 million tonnes out of the overall 1,621 million tonne drop — was accounted for by reduced ground transport emissions. With truck traffic probably little affected by the pandemic, as indicated by the mere 3.4 percent drop in world carbon emissions from industry, the decline presumably is attributable to decreased use of passenger vehicles. The reduction in aviation emissions was even more pronounced, at 36 percent, as many air travelers deemed it unwise to spend hours in confined aircraft spaces, and teleconferencing filled in for most business travel. The reduction rate might have been higher still, but for “ghost flights” resulting from byzantine government regulations and financial incentives.
There’s something satisfying in seeing year-on-year carbon emission figures in negative-land, even as we can’t deny the enormous human and social suffering that not only accompanied but to an extent delivered the reductions. A global pandemic causing over 1.3 million deaths and rising, according to the count maintained by Johns Hopkins University, and stunting child development as “remote learning” replaces in-person schooling, to name but one societal forfeiture, is not the path anyone would choose to curb climate-wrecking use of fossil fuels.
Perhaps we could look to the European Union, which pulled off a nearly 14 percent drop in carbon emissions from power generation, accounting for an absolute reduction of 105 million tonnes thus far in 2020 vs. 2019. In contrast, Carbon Monitor’s “Rest of World” group — encompassing all countries other than China, India, USA, Russia, Japan, Brazil and the EU — shaved only 1 percent from its power generation emissions, a decrease of just 27 million tonnes from 2019 emissions of 2,775 million tonnes. A deep dive into the disparate reductions might be useful for devising abatement strategies going forward.
This post only skates the surface of the data made available by Carbon Monitor. Their downloadable Excel file comprises some 36,000 entries: CO2 emissions for every 2019 and 2020 day (Jan-Sept) for five categories by eight countries or regions (some rows capture individual European countries: France, Germany, Italy, Spain and the UK). The daily data provide a quantitative window into that terrifying but bracing springtime period when lockdowns pushed emission rates in the US and other countries 20 or even 40 percent below year-earlier levels. The CM graphics (same link as above) are marvelous as well, as is an Oct. 14 article in Nature Communications by three CM staff distilling and interpreting their quantitative findings.
The second bar graph was added on Nov. 24. Drop us a line (email here) to share your own excavations of the Carbon Monitor data, or if you’d like us to send you our spreadsheet distilling CM’s data as used in this post.
The G.O.P. senators to target for a carbon tax
Addendum two years on, to note today’s NY Times story, 12 Republican Senators Who Crossed Party Lines (print edition), with its dozen tales of G.O.P. independence and a modicum of political bravery in bucking Republican party-line homophobia to vote for the Respect for Marriage Act, which Pres. Biden signed on Dec. 13. The dozen were these nine: Capito (WV), Collins (ME), Ernst (IA), Lummis (WY), Murkowski (AS), Romney (UT), Tillis (NC), Sullivan (AS) and Young (IN); plus three who are retiring: Blunt (MO), Burr (NC), and Portman (OH). The nine still in the Senate should be top of mind for carbon tax advocates looking for bipartisan Senate support. — C.K., Dec. 14, 2022.
As I was writing this post, I saw on Twitter that not a single sitting Republican U.S. senator accepted an invitation to appear on Meet the Press today. Though that could mean many things, the refusal of the entire G.O.P. senate conference to be interviewed by the pre-eminent Sunday mainstream media talk show bodes poorly for productive policy and political dialogue going forward.
What makes Republican intransigence especially disheartening is that even if the Democrats manage to defy the odds and capture both seats in Georgia’s Jan. 5 U.S. Senate elections, giving them a one-vote majority by virtue of the vice-presidential tie-breaker, they may still need Republican votes to pass impactful climate legislation in the next Congress.
Those votes could offset a possible No vote by one of the Democrats’ own: Joe Manchin, a legislator best known for a 2010 campaign video in which he fired a bullet through a handbill promoting the Democrats’ carbon cap-and-trade bill “because it’s bad for West Virginia.” The Mountaineer State is famously coal-dependent and pro-Trump. Only 30 percent of voters there chose Biden on Nov. 3, his lowest share in any state except Wyoming. And Manchin is up for re-election in 2022.
Sen. Manchin may not be the only Democratic senator turning his back on climate legislation when Congress convenes in January. Arizona’s Kyrsten Sinema began her political career with the Green Party but has since tacked right. Her senatorial voting record last year was even more conservative than Manchin’s, according to GovTrack’s “Ideology Score.” Since she’s not up for re-election till 2024, she could decide that she would have time to recoup from a pro-climate vote.
Georgia aside, then, any climate bill worthy of the name may need Republican votes to clear the Senate. Is there any prospect of getting even a single G.O.P. senator to vote for, say, a revenue-neutral carbon tax like fee-and-dividend — a measure that wouldn’t expand government and thus might be considered “on brand” with traditional Republican principles, as we noted in a post here the day after the election?
Hard experience with the Republican conference over the past dozen years would suggest no. On the other hand, inexorably rising climate concern and the growing call for climate action point to at least a possibility that a few G.O.P. senators might see it in their interest to stand down Mitch McConnell and defect from his party’s deflect-and-deny strategy.
CTC’s ranking system for senatorial climate-openness
We’ve ranked the 52 Republican incumbent and incoming senators (that’s this month’s 50 G.O.P. winners plus Georgia’s Perdue and Loeffler) by their openness to climate legislation. We made six indices — two pegged to each state’s fossil fuel dependence, two reflecting its sensitivity to climate chaos, and two denoting senators’ individual insularity from pro-fossil-fuels political pressure. We developed 1-to-5 scales for all six criteria and scored the senators on each. The maximum possible score was 30, and the lowest was 5.
And the highest scorer is Susan Collins, whose upset victory on Nov. 3 will vault her to a fifth term. Our ranking system gives her 27 points: 5 (the maximum) for Maine’s low coal dependence and high use of renewables, for its independence from fossil fuel extraction and carbon-intensive Big Agriculture, for the state’s high (among states with Republican senators) vote share for Joe Biden, and for what we call distance from the far right (Collins’ 2019 GovTrack score was the most liberal among G.O.P. senators; plus a score of 3 for Maine’s climate vulnerability; and a 4 for what we term freedom from re-election worries — Collins has six years before her re-election comes ’round again. Although she’s 68, that’s not much more than the Republican senatorial average age of 63, giving Collins a relatively low “lame-duck likelihood” based on age-related retirement.
At the bottom of our scale, with scores of 10, are a couple of senators from primo American fossil fuel sacrifice zones: Kevin Cramer of North Dakota and John Barrasso of Wyoming. Both states place below-average in climate vulnerability, low in climate concern, high in coal burning and energy extraction generally, and frustratingly mediocre in deploying wind and solar. Moreover, both senators sport far-right voting records and are just in their 50s, making them good bets to stand for re-election when their terms end in 2024. (We won’t belabor the fact that ND and WY rank 47th and 50th in population, and that their combined population, just 1.34 million, is less than half of one percent of the total U.S. population of 330 million.)
Collins’ 27 score leads her conference by far, suggesting that carbon-tax and other pro-climate advocates should be targeting her heavily. If her state’s Democratic tilt, independence from coal and fuel extraction and Big Ag and relatively high deployment of renewables, along with her relative centrist leaning and six-year window before facing the voters again, won’t incline her toward supporting climate legislation, it’s hard to picture any other Republican senator going that way.
These six are next:
♦ Richard Burr (NC), 22 score, on account of NC’s high climate vulnerability (think Outer Banks), relatively high Biden vote and relative independence from fuel extraction and Big Ag, as well as Burr’s own distance from the extreme right. On the down side, he’s up for re-election in 2022.
♦ Lindsey Graham (SC), 21, due to the state’s low economic dependence on fuel extraction and Big Ag, his relative distance from the far right, and the fact that his seat is secure till 2026.
♦ Charles Grassley (IA), 21. Advocates who subscribe to Vox columnist Dave Roberts’ thesis that a robust renewables sector must precede climate legislation should target Grassley on account of his state’s huge wind industry (the country’s largest, percentage-wise). Plus, at age 87, his 2022 re-election campaign will probably be his last.
♦ Tom Tillis (NC), 21 — yep, the guy who just withstood a strong challenge from Democrat Cal Cunningham. Tillis’s profile is similar to that of fellow North Carolinian Richard Burr, with greater insulation from political opposition but a more right-wing voting record, according to GovTrack.
♦ Pat Roberts (KS), 20. Fresh off re-election, the 84-year-old Roberts should be immune to electoral pressure. His other big plus is Kansas’ vibrant wind sector, second only to that of Iowa in percentage terms.
♦ Rick Scott (FL), 20. The Sunshine state’s stark vulnerability to sea-level rise, along with its relatively high Biden vote share (48%) and its lack of fossil fuel production, give it high relative potential. (Fellow FL Senator Marco Rubio scored less, 18, due to his pending 2022 re-election campaign.) Sadly, Florida’s failure to live up to its nickname where energy production is concerned holds back both senators’ likelihood of going pro-climate.
Notably absent from the top ranks is Utah Senator Mitt Romney, who earlier this year defied both President Trump and Leader McConnell by voting to convict the president of impeachment — the lone Republican to do so. Romney scored just 15, slightly below the sample average of 16. Utah ranks high in fuel extraction, and the state’s electricity sector is almost twice as coal-dependent as the average for other Republican senators — factors probably reflected in Romney’s outspoken support for the state’s oil, gas and coal industries. Further hurting Romney’s score was Utah’s low Biden share, 38%. The same dynamics along with a pending 2022 re-election campaign resulted in a middling 18 score for another ostensible Republican maverick, Alaska’s Lisa Murkowski.m, despite her state’s extreme vulnerability to climate damage.
You may have noticed that our rankings omit personal political preferences. Who knows, perhaps Romney’s courage on impeachment could signal willingness to break with McConnell on climate. Similarly, as we wrapped this post we got word that Indiana Sen. Mike Braun, who like Romney received an undistinguished 15 score, has volunteered to co-lead the U.S. delegation to the next U.N. COP (Coalition of the Parties) global climate meeting in Glasgow next November. Clearly, our rankings are far from all-inclusive, but hopefully they can be useful as a screening tool.
The major takeaway here is that in addition to working to elect Georgia Democrats Raphael Warnock and Jon Ossoff to the U.S. Senate, climate campaigners need to start focusing their resources to move Republican senators to act on climate in the new Congress.
Link to the CTC rankings spreadsheet: http://www.komanoff.net/fossil/GOP_Senators_Ranked.xlsx.
This post was updated on Nov. 16 to include a sentence about Senator Murkowski.
- « Previous Page
- 1
- …
- 9
- 10
- 11
- 12
- 13
- …
- 169
- Next Page »