This essay also appeared today in Streetsblog USA. The version here adds a table and line graph and a few explanatory words.
U.S. electric vehicles are only slightly less harmful to the environment and society than conventional gasoline cars, according to a new in-depth analysis by researchers at Duke, Stanford, U-C Berkeley and the University of Chicago.
This surprising finding — a mere 10 percent difference between electric and gasoline vehicles’ lifetime externality costs — emerges from a detailed “working paper” that the team of researchers posted earlier this month to the prestigious National Bureau of Economic Research.
 The paper, The Effects of ‘Buy American’: Electric Vehicles and the Inflation Reduction Act, includes the first attempt in a decade or more to monetize and aggregate automobiles’ primary direct harms: climate damage from manufacture as well as driving, along with crash deaths and non-climate pollution. EVs perform worse than GVs (gasoline vehicles) on three of these scores, according to the paper. Only on climate-damaging carbon emissions from driving do electrics triumph decisively over gasoline cars.
What’s keeping EVs from slam-dunk superiority over GVs? In a word, batteries. The batteries required to keep an electric vehicle moving make car manufacture far more energy-intensive for EVs than GVs, while their increment to vehicle weight — half-a-ton for a small EV, a ton or more for a standard large — renders EVs deadlier in crashes.
None of this comes as news to regular Streetsblog readers or aficionados of “car bloat” arch-foe journalist David Zipper. The new wrinkle in the NBER paper is its extensive monetization of harms. The paper suggests that the combination of EVs’ excess manufacturing energy and extra weight-caused fatalities undoes a third to a half of electric vehicles’ societal benefit from their lesser carbon emissions from driving. (See graph above.)
There’s more. Putting aside CO2 and climate, the NBER paper rates electric cars as worse polluters than gasoline cars when electrics’ associated smokestack emissions are properly counted. Yes, you read that right: the paper finds that particulate and gaseous emissions resulting from EV battery recharging are more harmful to health and the environment than gasoline cars’ tailpipe emissions — contrary to widespread faith in electric cars as an urban pollution solution.
Incremental vs. Average Emissions
Making sense of that finding starts with grasping that emission controls and cleaner gasoline — mandated by federal regulations that the auto and oil industry fought every step of the way — have slashed pollution from conventional autos compared to their 20th century precursors. I remarked on this enormous if underappreciated change in my tribute on Streetsblog to Brian Ketcham, the protean automotive engineer who died in August.
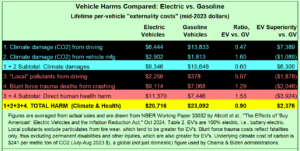
Data in table were used to derive bar chart, above.
Moreover, most U.S. power grids remain majority-carbon, notwithstanding wind and solar power’s rapid expansion. This means that plugging in an EV for recharging rarely summons additional power from non-carbon-based renewables or nuclear plants, since these are already running at their maximum capability. Rather, EV recharging anywhere in the 50 states tends to trigger increased output by gas- or coal-fired generators, especially the latter, which these days function as many grids’ swing generation.
The NBER authors’ pollution accounting meticulously (and correctly) assign those power plants’ incremental carbon and particulate emissions to the EVs. (Use of grid averages — the “default” in popular EV-climate discourse — isn’t just lazy, it greenwashes electric vehicles by crediting them with carbon-free electrons that should be allocated to pre-existing electricity usages.)
Despite my comfort with “incremental” rather than “average” pollution accounting — the approach I practiced in my long-ago career analyzing the U.S. power sector — I was still taken aback by the NBER researchers’ finding that EVs’ smokestack particulates and gases outweigh gasoline vehicles’ tailpipe harms by 6-to-1. But even dropping these “local damages” from the comparison, the other three harm categories combined give EVs only a 20 percent win vis-a-vis GVs. While that advantage ain’t beanbag, it’s a far cry from the prevailing conception of EVs as “green.”
It’s also a stark reminder of automobile dependence’s social unsustainability. Like it or not, the fact is that electric vehicles, though endlessly touted as benign, impose immense harms. And the NBER cost figures exclude the tens of thousands of permanently disabling car injuries each year (they only include fatalities), the health and ecosystem damage from the heavier EVs’ extra tire wear, and car culture’s budget-busting, soul-breaking impacts on Americans.
Also bear this in mind: The climate costs in the graph at the top of this post were calculated with a fairly aggressive “social cost of carbon” of close to $250. While the true cost of each metric ton of CO2 emitted today is probably higher — think of Hurricanes Helene and Milton, and the coming fallout from skyrocketing or unavailable home insurance, for starters — no country in the world actually prices (i.e., taxes) its carbon emissions at even half that rate. Using cost figures in the NBER paper, I’ve calculated that at any social cost of carbon below $150, the average EV is more harmful societally than the average gas vehicle.
 That EVs improve only modestly on GVs under reasonably broad social accounting is sobering. Yes, their climate benefit is substantial, around 1.7 to 1 (throwing in manufacturing CO2 with driving CO2). But that ratio is miles away from a clean sweep. And with NIMBYs, NEPA and other obstacles to a truly green grid, it’s not going to rise very much for a while.
A caveat: cataloguing and estimating automobile externalities, while a feature of the NBER paper, wasn’t its focus, which was to evaluate the generous subsidies to EVs (and their batteries) in the Biden administration’s Inflation Reduction Act of 2022. The paper itself is technical and laced with jargon and I may not have grasped every nuance.
That said, here are the NBER paper’s key bottom lines on car harms, as I understand them:
- Based on current U.S. electric grids, and including vehicle manufacture along with driving, EVs are 40 percent less climate-polluting on average than gasoline vehicles (GVs).
- Adding in the costs of car crash deaths to the above climate (carbon) pollution costs, EVs in the U.S. are 19 percent less societally harmful than GVs, on average.
- Also adding “local” tailpipe and smokestack pollutants to the calculation in #2, EVs are only 10 percent less societally harmful than GVs.
- Finding #3 rests on figures in the NBER paper indicating that smokestack pollution from EV charging causes six times as much health and other harms as GV tailpipe pollution — a finding that warrants close vetting. (The NBER authors directed me to their model results but refused my entreaties for a more convincing explanation of that finding.)
- Results 1-3 omit non-fatal crash injuries (an omission favoring EVs), particulates from tire wear (also favoring EVs), geopolitical entanglements from oil dependence (an omission favoring GVs), noise pollution, and other physical and societal maladies from automobile dependence.
- Even with those omissions, the lifetime unpriced costs from both types of vehicles average more than $20,000, a figure that would tack on 40 percent or more to today’s average U.S. $48,000 purchase price of new automobiles.
- Findings 2, 3 and 6 assume a fairly aggressive “social cost of carbon” — close to $250 per metric ton of CO2.
Yes, EV harms will diminish over time as U.S. grids decarbonize. Nevertheless, the NBER paper suggests that progress in that direction has fallen short of green hype, and that on a broad social scoreboard EVs’ greater mass is undercutting electrics’ climate potential.



 This impressive scale-economy made sense — on paper. Costs tend to track equipment surface areas, while capacity is proportional to reactor volume, portending only a 60 percent rise in costs per doubling of capacity. (Mathematically, two raised to the two-thirds power is roughly 1.6. Why two-thirds? Because surface area rises with the square of length while volume rises with the cube.) This would dictate a 20 percent reduction in per-kW costs from doubling plant capacity. Other cost elements like siting, permitting, engineering, and project mangement would, it was thought, display steeper economies, lifting the overall per-kW cost reduction per doubling of capacity to around 25 percent.
 For Vineyard Wind, then, and perhaps for the Dogger Bank project as well, paper savings from going large have become a cruel joke, at least for the time being. Putting that aside, I’ve calculated the theoretical carbon price that would raise the sale price of wind electricity by the same amount that a halving of turbine capacity raised its all-in cost. Rephrased as a question: How big of a carbon price would have to be baked into the cost of prevailing fossil-fuel electricity — assumed to be from the mainstay of the U.S. power system, a combined-cycle power plant burning methane gas — to compensate for sticking with prior 6-7 MW sized offshore wind turbines and, thus, foregoing the assumed 25 percent per-kWh cost reduction from doubling turbine sizes to 13 megawatts?
