Editorial in Global Times, a Chinese paper that The New York Times characterized as “a state-run nationalist newspaper” in a March 29 news story, China Poised to Take Lead on Climate After Trump’s Move to Undo Policies.
Carbon tax ‘consequential’ as UK emissions fall to 1894 levels
This post was researched and written by CTC intern Michael Kendall. More recent info, including 2016 carbon emissions data, are in the U.K. section of our Where Carbon Is Taxed page.
The United Kingdom, the birthplace of the Industrial Revolution and a kingdom built on coal, has cut emissions of carbon dioxide to levels not seen since the late 19th Century, according to a report from the UK consultancy, Carbon Brief.
CO2 emissions from fossil fuel burning in the UK (England, Scotland, Wales and Northern Ireland) totaled just 381 million metric tons (“tonnes”) last year, a 6 percent decrease from 2015 and 36 percent less than levels in 1990 (or 44 percent less than levels in 1970 when CO2 emissions peaked at 685 tonnes).
As Carbon Brief noted, total UK emissions hadn’t been that low since 1894, save for 1921 and 1926, when miner strikes paralyzed the coal industry.
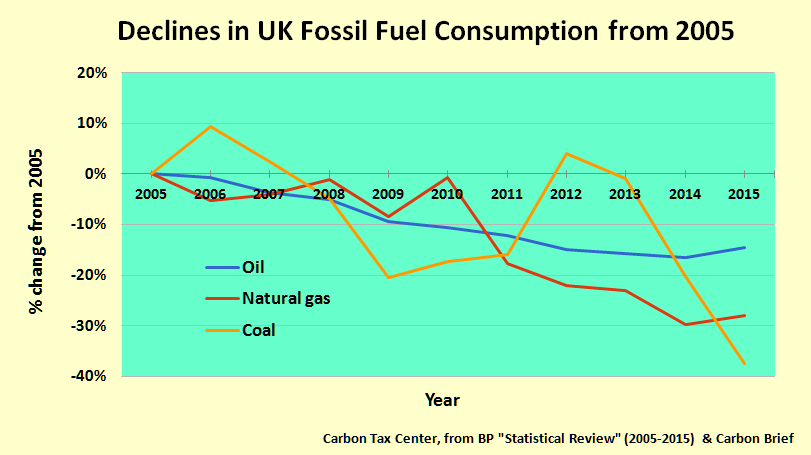
No more carrying coals to Newcastle, as the historic but filthy fuel disappears from the UK.
Coal burning is disappearing from the former perennial bastion of coal, while use of oil and gas is down considerably from 2005, despite upticks since 2014 for both fuels. At the same time renewables are thriving, with a Carbon Brief analysis showing that wind generated more electricity throughout the UK than coal in 2016.
Data from British Petroleum’s comprehensive annual Statistical Review of World Energy show coal consumption in 2015 down 38 percent from 2005. That steep drop has driven down total CO2 emissions from UK fossil fuel combustion nearly 25 percent over the same period. (The UK Department for Business, Energy and Industrial Strategy will release official figures later this month.)
These reductions stem from a coordinated effort to cut emissions, reliant upon setting a national price on carbon in 2013. “Perhaps the most consequential factor,” says Carbon Brief editor Simon Evans, “is the UK’s top-up carbon tax, which doubled in 2015 to £18 per tonne of CO2.” (Brits sometimes refer to their carbon tax as a “top up” tax since it was intended to top up the carbon price determined via the auctioning of emission permits under the EU’s Emissions Trading Scheme.)
The UK carbon tax equated to $24-$25 per short ton in 2016, at last year’s average 1.5-to-1 sterling to dollar exchange rate (the exchange rate is a good deal lower at this writing in 2017, however), and converting metric to short tons. A carbon tax targets coal above all, on account of coal’s higher carbon content per Btu compared to oil or gas, which enhances the profitability and deployment of zero-carbon substitutes for coal-fired electricity, such as wind. And in fact Evans has charted the month-by-month collapse in coal use.
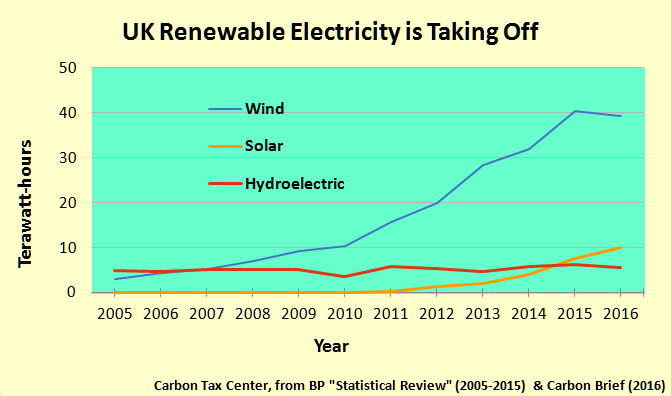
UK wind turbines generated more electricity than coal-fired plants in 2016, reports Carbon Brief.
Last week Drax, an energy generation company specializing in biomass, presented commissioned research taking carbon pricing a step further. The researchers modeled the likely impact on use of coal and natural gas and CO2 emissions from alternatively removing or doubling the UK carbon tax. Their models show that without the carbon tax, coal generation would have doubled and emissions would have risen 21 percent, significantly undercutting past emission gains; whereas doubling the tax would have cut coal generation by an extra 47 percent and shaved another 10 percent off overall CO2 emissions.
Continuing the good news: belying the standard notion that pricing carbon emissions must increase household energy bills, UK households paid less in energy bills (gas plus electricity) in 2016 than they did in 2008. We’ll look to Simon Evans for a summary:
Since 2008, household consumption of gas is down by 23% and electricity by 17%, cutting the average bill by £290 and more than offsetting the increase in policy costs over the same period… These energy savings are largely the result of energy efficiency policies and regulations, from UK rules mandating more efficient condensing boilers to EU product policy on more efficient fridges and ovens.
In short, while the price per kWh of electricity has risen for UK households, improvements in efficiency have cut household usage even more, enabling total household costs to fall. This stands as a model instance of regulation working in tandem with carbon pricing, as more-efficient appliances became more available due to regulation and more attractive due to the higher unit cost of electricity.
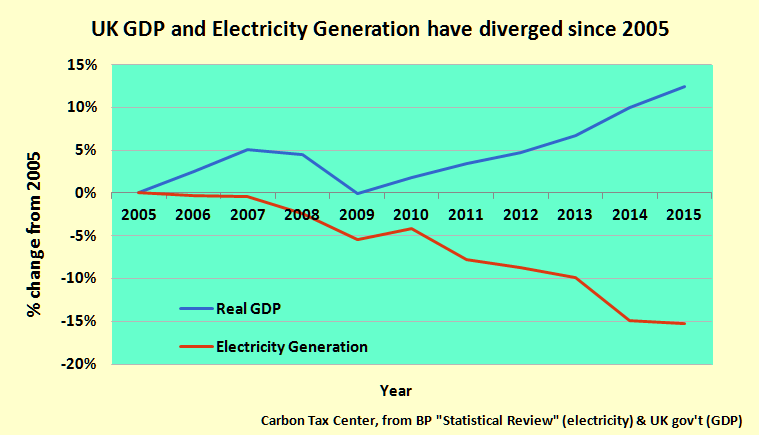
An unprecedented 15 percent drop since 2005 in electricity generation has helped drive down emissions as the UK economy has grown.
A further dividend of electricity savings, of course, is that the nationwide increase in electricity from wind turbines and gas-fired generation has been at the expense of coal rather than in addition to it — mirroring the U.S. experience since 2005 that we distilled and quantified in our December report, The Good News.
Where does the carbon tax stand now, with last year’s Brexit vote set to remove the UK from the European Union? The government’s March 2011 Budget set a 2020 target of a £30 per tonne tax on CO2, but in 2014 that figure was reduced to £18 via a price cap until 2020. In 2016 this cap was extended to 2021 “to limit the competitive disadvantage faced by business and reduce energy bills for consumers.” (See “The Carbon Price Floor” House of Commons briefing paper, p.3.)
Last week’s Spring Budget 2017 is vague about the future of the carbon price floor, stating that the “government remains committed to carbon pricing” but reserving details until the Autumn Budget 2017. The most promising statement in the budget is this, at page 34: “Starting in 2021-22, the government will target a total carbon price.” It suggests that the UK intends to continue to price carbon despite the country’s imminent exit from the EU. Carbon Brief provides a fuller analysis of the Budget’s potential impact on climate policy.
House GOP resolution plants a marker for eventual climate action
Note: This post was updated in mid-May to reflect three additional signatories.
Republicans hold 241 seats in the U.S. House, a 47-vote margin over the Democrats’ 194. Earlier this week, 17 [now 20] of the GOP members issued a resolution “expressing the commitment of the House of Representatives to conservative environmental stewardship.”
The resolution doesn’t call for a carbon tax or any specific climate action; it doesn’t even mention “climate change,” though it does refer to “a changing climate.” In fact, the resolution is word-for-word identical to one issued eighteen months ago, in September 2015, also by 17 House Republicans, a group that included 10 of the signatories of the new resolution. (The other seven signers from 2015 are out of office — five declined to run, and two lost their seats to Democrats last November; none were “primaried” out. Of the seven new signers, four were newly elected to the House in 2016.)
Nevertheless, the resolution stands as a positive if halting step in the possible emergence of a critical mass of Republican officeholders to endorse and eventually vote for a carbon tax to combat climate change.
The resolution was by and for House Republicans only, a not unreasonable way to strike a small flame that would not be overshadowed by solid Democratic support for climate action. The 17 [now 20] signers hail almost evenly from Trump states and Clinton states, with four [now six] from New York, three each from Pennsylvania and Florida, and the other seven [now eight] from seven [now eight] other states. Only one represents a heartland state — Don Bacon, who just won election to the House from Nebraska — though two [now three] others are from the mountain West: Mark Amodei of Nevada and Mia Love of Utah [and also Mike Coffman of Colorado]. (See map.)
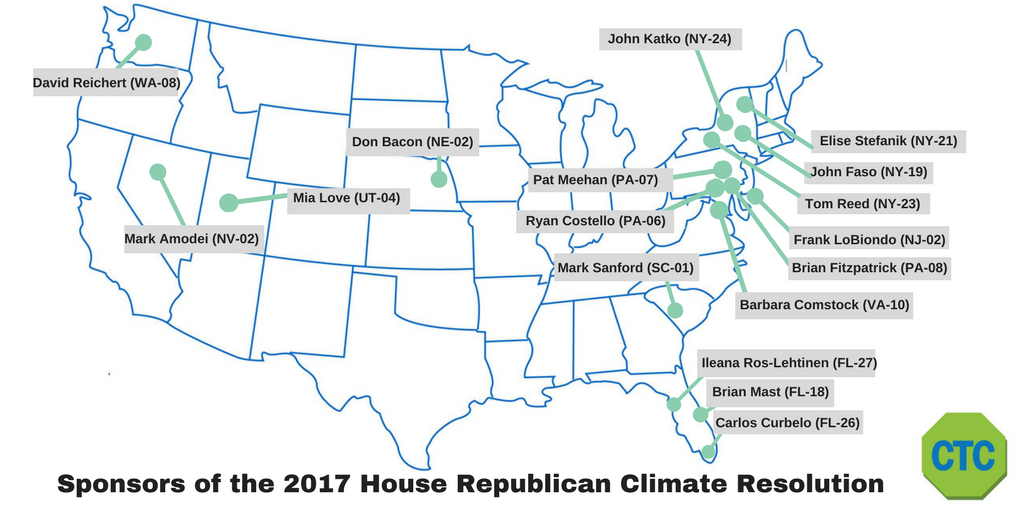
The 17 GOP House members who signed the March 14 resolution. Not shown: 224 Republicans who didn’t, although three of those signed on in May: Mike Coffman (CO-06), Peter King (NY-02) and Dan Donovan (NY-11).
The resolution kicks off with this “whereas”:
[I]t is a conservative principle to protect, conserve, and be good stewards of our environment, responsibly plan for all market factors, and base our policy decisions in science and quantifiable facts on the ground. (emphases added)
Mild stuff since the time of Teddy Roosevelt — or the dawning of The Enlightenment — but relatively bold in the current era of Republican denial of science and dismissal of considerations that might interfere with short-term profit.
It goes on for eight more whereases, culminating (or petering out) with this resolution:
Resolved, That the House of Representatives commits to working constructively, using our tradition of American ingenuity, innovation, and exceptionalism, to create and support economically viable, and broadly supported private and public solutions to study and address the causes and effects of measured changes to our global and regional climates, including mitigation efforts and efforts to balance human activities that have been found to have an impact.
Weak tea, to be sure, but the point isn’t the resolution’s text but its existence. A small flag planted in an otherwise barren landscape.
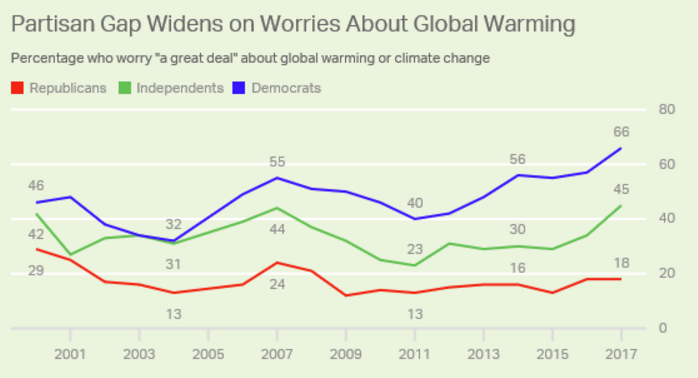
More Dems and Independents “are worrying a great deal about global warming,” reports Gallup. But not Republicans.
And barren it is, on the GOP side. The Gallup Organization this week released new poll data indicating that amidst an upsurge in Democrats and self-declared Independents who “worry a great deal about global warming,” the share of Republican worriers is stalled below 20 percent (see graph at left). That’s less than the rate a dozen years ago, before the Koch Brothers launched their insidious campaign to cloak denialism in pseudo-scientific respectability and ensure that GOP office-holders shield fossil fuel interests from regulation.
Note that our Polls page has more on the Gallup findings along with new and more encouraging data showing growing support for carbon taxes, from the National Survey on Energy and Environment (NSEE) from the University of Michigan and Muhlenberg College.
The graph makes clear that many Republican office-holders — unlike the distinguished party elders who last month unveiled the Climate Leadership Council‘s right-of-center, revenue-neutral fee-and-dividend proposal — are skating on thin (melting?) ice. Yet despite, or perhaps on account of, the “lite” nature of their climate resolution, they deserve our support. Here’s what you can do:
- If you live in one of the 17 [now 20] districts represented in the map above, write to your Congressmember expressing appreciation and support for participating in the March 14 resolution.
- If you live in one of the other 224 [now 221] other districts represented by Republicans, write your Representative and urge/insist s/he sign on.
- If you live in any of the 194 districts represented by Democrats, let your representative know about the resolution and urge her/him to reach across the aisle to support the 17 [now 20] signers — particularly those from their state.
As you write your representative, you may want to consult FiveThirtyEight’s listing of your district’s Trump-vs.-Clinton vote from last November. It shows 21 districts where Clinton outpolled Trump but with a Republican member who hasn’t signed the resolution; they may be more amenable to suasion than other GOP representatives.
At least as important, join and support Citizens’ Climate Lobby, which since 2009 has been organizing to create political will for carbon taxes and which played a major role in both the 2015 and 2017 resolutions. A new CCL Web page on the Republican Climate Resolution makes it easy to take the first two steps outlined above.
What the WSJ Got Wrong About the Shultz-Baker Carbon Tax Proposal
The carbon tax proposal that the Climate Leadership Council unveiled last month upends orthodoxies on both sides of the political divide. It is revenue-neutral, which goes against the desires of many on the Left to invest carbon tax revenues in a “just transition” to clean energy. It distributes those revenues as “dividends” to U.S. families, an income-progressive outcome that frustrates those on the Right who might accept a carbon tax as a way to pay for reducing the corporate income tax, at least in theory.

Editorial endorsements for the Shultz-Baker carbon tax proposal, as of March 1.
We at CTC heartily endorsed the council’s proposal in a blog post hours after its release. So did a dozen leading newspapers, including the Dallas Morning News, the Houston Chronicle, the Financial Times and Barron’s, some of which were likely impressed that the CLC rollout was led by GOP icons James Baker and George Shultz, both of whom held multiple cabinet posts in earlier Republican administrations. But that wasn’t good enough for the Wall Street Journal, whose editorial page sometimes reads as if written by the Koch Brothers-financed, climate change-denying Americans for Prosperity. Its Feb. 25 editorial attacking the CLC proposal, The Carbon Tax Chimera, didn’t so much rebut the proposal as excoriate it.
Messrs. Shultz and Baker responded in a letter in the Journal last Friday, We Thought We Would Hit Your Sweet Spot. Their letter isn’t aimed at the Journal’s editors, who are tethered to hard-right climate denialism, but to the paper’s remaining readers who recognize that catastrophic climate change poses risks to their bottom line (and themselves) and are looking for a policy response they can support. In the same spirit, we present this point-by-point rejoinder to the Journal’s editorial by Dr. Peter Joseph, group leader of the Marin County, CA chapter of Citizens’ Climate Lobby. Dr. Joseph is an outspoken advocate for the fee-and-dividend approach to carbon taxing which forms the heart of the CLC proposal.
* * * * * * * * * * * * * * * * * * * * * * * * * * * * * * * * * * * * * * *
1. WSJ: The climate may change but one thing that never does is the use of climate change as a political wedge against Republicans.
Dr. Joseph: Following Sen. John McCain’s 2008 campaign acknowledgment of climate change, it was Republicans who turned climate change into a wedge issue by conflating scientific uncertainty — a necessary and ever-present part of scientific inquiry — with the well-established scientific consensus about global warming. The Journal seems not to appreciate that the Shultz-Baker plan, tailored to appeal to fiscal conservatives, can serve as Republicans’ escape ladder from this untenable position once they let go of the “I am not a scientist” trope and decide to join every other major political party – including conservative — in the Western democracies and get serious about this threat.
2. Also never changing is the call from some Republicans to neutralize the issue by handing more economic power to the federal government through a tax on carbon.
Revenue neutrality with 100 percent of the revenues returned to U.S. families as carbon dividends actually deprives the federal government of more economic power by channeling all the money back to citizens and reserving decision-making power to households, companies and markets.
3. The risk is that Donald Trump takes up the idea, which would hurt the economy with little benefit to the environment.
A fully refunded carbon tax will cut emissions with greater efficiency and less economic drag than regulations. It also produces greater environmental benefits and promotes business stability. The Climate Leadership Council estimates that by 2025 its plan will reduce CO2 emissions reductions by 28% below the 2005 baseline, meeting America’s Paris commitment. The Carbon Tax Center, modeling a more robust rise in the tax level after the initial $40/ton, estimates that the council’s plan would, by 2030, reduce our annual CO2 emissions from 2005 levels by 40 percent.
4. Such a tax might be worth considering if traded for radically lower taxes on capital or income, or is [sic] narrowly targeted like a gasoline tax.
Some economists recommend tax swaps, with Republican-leaning economists preferring cuts to the corporate income tax and Democratic-leaning ones favoring cutting the payroll tax. But politics point strongly to the dividend approach. The tax code is so complex, and Treasury Department bookkeeping so labyrinthine, that it’s extremely difficult to pull off a tax swap that’s immune to suspicions that the government is “stealing” the money. Accountability is crucial. Plus, the carbon tax has to rise each year, since it can’t start at the high levels that are required without seeming punitive. This requires the public to trust that the tax revenues will actually come back to them. A dividend like the council’s can win their trust, since the dividend checks rise in concert with the tax level.
5. But in the real world the Shultz-Baker tax is likely to be one more levy on the private economy.
Reinjecting billions directly back into the Main Street economy will act as a stimulant, not a drag. When families, particularly at the lower end, receive money regularly, they spend it. Sectors other than the hydrocarbon industry will benefit, and the predictable glide path toward the low-carbon economy will allow industry to adapt.
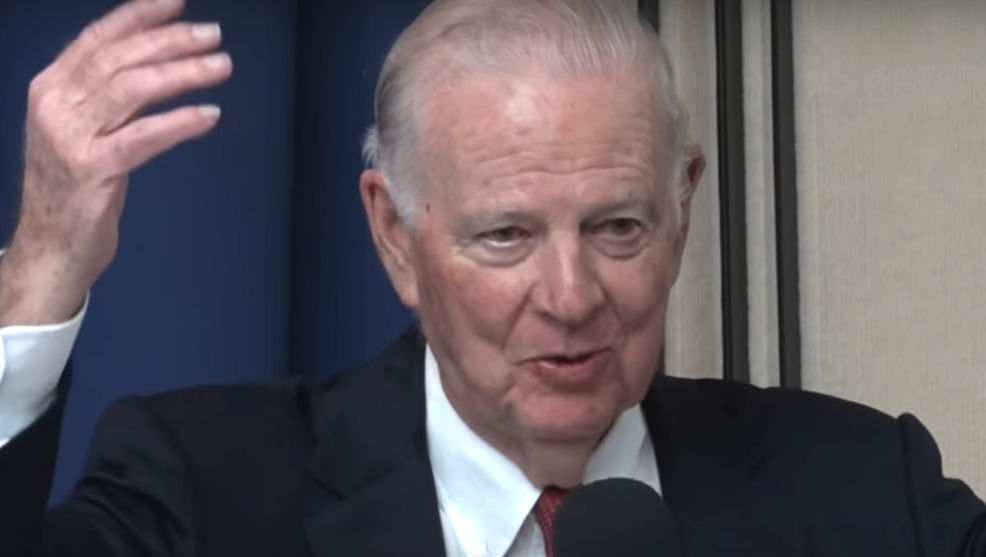
Former Secretary of State & Treasury James Baker, at the Climate Leadership Conference’s Feb. 8 rollout of its carbon tax proposal at National Press Club.
6. Even if a grand tax swap were politically possible, a future Congress might jack up rates or find ways to reinstate regulations.
The carbon tax signal should escalate predictably, and as long as the public receives the funds they won’t be inclined to revolt, since a clear majority will be made better off. As for wealthier households, many will hardly notice that their dividend checks don’t cover their carbon tax bite. Provided the tax levels are robust rather than token, Congress will have no incentive to “jack up rates” later on. Remember, Washington keeps none of the money.
7. Another problem is the “dividend.” A carbon tax would be regressive, as the poor spend more of their income on gasoline and household energy.
Full dividend return converts a regressive policy into a progressive one. The key is the dividend: since wealthier people have larger-than-average carbon footprints (they buy more stuff, live in bigger houses, fly more, etc.), they’ll pay in, while most middle-income and virtually all low-income families will take out. Models show that close to two-thirds of the population comes out ahead with full revenue return via dividends rebate. Citizens will retain the freedom to lower their consumption and use the spread between their carbon dividend check and carbon footprint costs as an incentive to reduce personal emissions and make some money, if they choose, without being required to do so by the government.
8. The plan purports to solve this in part by promising to return the tax to the American public. But the purpose of taxes is to fund government services, not shuffle money from one payer to another. No doubt politicians would take a cut to funnel into renewable energy or some other vote-buying program.
Taxes fund programs, agencies and services that make America great. But a fully refunded “tax” such as the council’s isn’t really a tax if the government doesn’t keep the money. It’s a fee, not intended to generate operating revenue but to correct a market failure. True, politicians might find it difficult to let huge sums slip through their fingers. As then-ExxonMobil CEO Rex Tillerson quipped in a 2009 speech advocating a revenue-neutral carbon tax, “I know that’s hard for a politician to say.” He suggested the tax be called “a refundable greenhouse gas emissions fee.” The U.S. government will return the funds unmolested as required by law.
9. The rebates would also become a new de facto entitlement with an uncertain funding future.
The dividends will rise initially, then level off and eventually — and predictably — decline as the rising fee does its job of lowering carbon intensity. (That decline is another argument against using the carbon revenue for tax swaps or government programs, as the eventual budget shortfalls would require a future Congress to raise taxes.) At the same time, energy from wind and sunlight, whose fuel is free, combined with efficiencies and innovative processes and products, will stabilize or decrease the costs of goods and services. What matters to citizens is their overall household budgets. There will also be savings in healthcare costs as the air gets cleaner, and presumably military expenditures as we wean off unstable sources of foreign oil.
10. Meanwhile, the energy import fee looks like an appeal to Mr. Trump’s protectionist impulses…The idea is an attempt to export U.S. climate and tax policy with the threat of tariffs, which other countries may resent.
The Journal would do well to look more broadly at the council’s border carbon tariff. It’s an incentive to other countries, a tool to ensure a level playing field for U.S. manufacturers, and an act of leadership by the world’s most vibrant economy. A sustainable climate and a habitable earth require controlling global emissions. Without a global carbon price, too many nations will be unable to fulfill the reduction targets they promised in Paris, which are all voluntary. The global economy is the only enforcement mechanism there is. From a practical political standpoint, without a border carbon tariff no carbon charge will ever get through Congress if it disadvantages U.S. exporters.
11. The tax rate would also be influenced by international climate models that have overestimated the increase in global temperature for nearly two decades.
Must the WSJ editorial page continue to cling to this wearisome canard, in the face of year after year of record-setting temperatures? As for alleged IPCC “overestimates,” presumably referring to the alleged “pause” in surface temperature increases, that spurious claim has been thoroughly debunked. The excess retained heat energy has been going into the oceans, where it’s accelerating the disintegration of the polar ice shelves — dams restraining the great land ice sheets —threatening much higher sea level rise than previously predicted and threatening to inundate vast stretches of our nation’s and the world’s coastal areas.
12. A carbon tax is always pitched as “insurance” against climate change, but no one thinks it will change the trajectory of temperatures.
That might apply to an anemic price signal. It hardly applies to a carbon tax that starts at $40 per ton of CO2 and rises from there. The data indicate that most known fossil fuel reserves must remain in the ground to prevent catastrophic warming. Only a robust price signal can enable markets to resist the disastrous allure of trillions of dollars worth of carbon products. A rising fee on carbon emissions is the most powerful lever we have to phase out fossil fuels as fast as practicable.
13. A 2016 paper from the Cato Institute makes the point that insurance policies hedge risks that are well-known, unlike climate change, whose risks are highly uncertain.
The Cato Institute, known for its climate denial, is hardly a source of sound advice. The scientific consensus tells us that the chances that climate change will wreak catastrophic damage on property, let alone ecosystems and civil society, are far greater than the probability that, say, one’s home will be destroyed by fire. Yet every homeowner has fire insurance.
14. Fossil fuels make up about 80% of U.S. energy; solar, wind and hydropower are more expensive and lack the scale to be a viable substitute.
Fossil fuels rose to dominance through political arrangements that externalized the true costs of dumping their combustion products into the atmosphere and oceans. One can argue that these costs were unknown until now. Today to not know is to deny reality. The carbon tax internalizes those costs, rectifying a massive market failure. Yet even without that tax, solar and wind are rapidly gaining market share and grid parity, and there are no limits to the eventual scope of their deployment. A carbon tax will accelerate this transition.

Harvard economics professor Greg Mankiw at the Feb. 8 CLC press conference.
15. Congress has never shown the self-restraint to collect an estimated $1 trillion in taxes and return it to the public. Any Republican who supported a carbon tax can expect no help from Democrats, who won’t restrain the Environmental Protection Agency.
As Secretary Tillerson observed, it is tough for a politician to utter the words “revenue neutral.” The public will have to demand it, and the business community, understanding that climate disasters are terrible for business, must lobby for it. Elected officials will then follow. The Shultz-Baker plan calls for suspending most EPA authority over CO2, an olive branch to anti-regulation interests. Evidence that Democrats and their environmental allies might be willing to relinquish control over the carbon tax revenue stream can be found in the resolution that California’s Democratic-controlled legislature passed last August calling on Congress to enact a revenue-neutral carbon fee and dividend proposal similar to the Shultz-Baker plan.
16. You won’t read this elsewhere, but what’s driven the recent reduction in U.S. carbon emissions is fracking for natural gas, which might never have happened had a carbon tax been in place.
While it’s undeniable that fracked gas contributed to overall reductions bydisplacing dirtier coal, a recent report by the Carbon Tax Center established that since 2005 the combination of electricity savings from efficiencies and increased wind and solar have played a greater part in reducing carbon emissions tha the replacement of coal by gas. Moreover, efficiency, wind and sunlight — unlike fracking — generate zero emissions of methane, which is also a potent greenhouse gas.
17. Human ingenuity and prosperity are the best insurance against climate change.
Perhaps. But even human ingenuity is hard pressed to overcome broken markets that fail to price carbon emissions’ damages. As Harvard economics professor Gregory Mankiw pointed out in the CLC press conference rolling out the carbon dividend plan (@32 min), a carbon tax is as close to a silver bullet as there is, precisely because it engages the enormous power of money and markets, with minimal risk, in a nonpartisan way. The WSJ should support it.
Dr. Joseph may be reached at pjmd1
If Midwestern states like Kansas start leading on renewable energy, choosing renewable energy, working in renewable energy jobs, associating their state identity and state pride with renewables — that, more than anything, is likely to shift their opinions on global warming (and openness to serious climate policy).”
Vox blogger David Roberts, in Renewable energy draws increasing Republican support. That could shift climate politics., Feb. 16.
What the Surge in U.S. Driving Says about Carbon Taxing
Driving in the United States didn’t just inch upward during the past two years, it practically erupted. Total on-road vehicle-miles traveled (VMT) by cars, trucks and buses jumped by 87.5 billion last year, after increasing the year before by 105.2 billion, according to FHWA data. The two-year increase, nearly 193 billion miles — that’s just under 600 miles for every U.S. resident — is the largest in U.S. history (see graph).
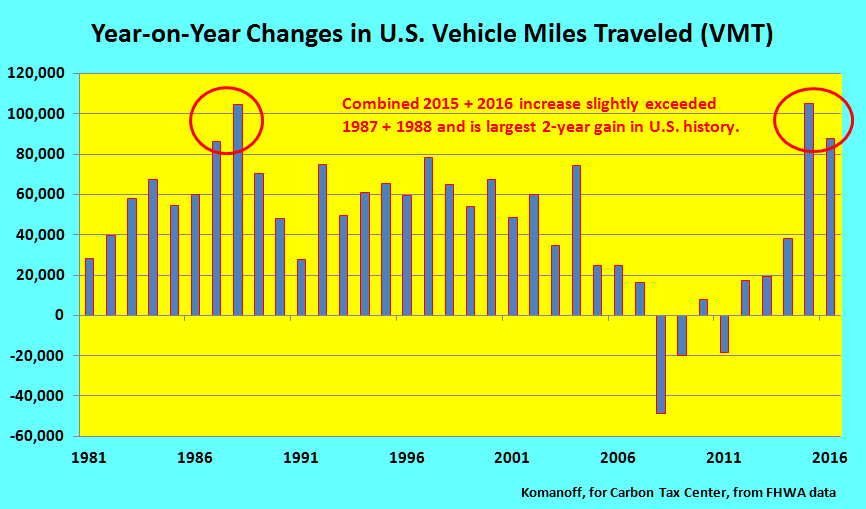
2014-2016 VMT rise was biggest 2-year jump ever (yes, we checked all the way back).
Percentage-wise, the increases may not look momentous — 3.5 percent in 2015 and another 2.8 percent last year. But the two-year growth percentage, 6.4 percent, is the highest in almost three decades. And it comes after a spate of articles and reports celebrating (or decrying, depending on one’s point of view) the arrival of “peak driving,” or, at least, peak driving per capita.
So what’s going on?
The prime factor couldn’t have been population growth; it totaled just 1.4 percent from 2014 to 2016. And let’s not over-credit 4.2 percent economic growth over the same period, since the level of driving is more molasses-like than GDP, as we discuss further below. (Also note that GDP subsumes population, so the two factors wouldn’t be additive.) What about pent-up demand from the 2008-2011 economic slowdown? It makes for good anecdotes but probably not enough to move the dial.
My candidate for key cause of the surge in U.S. driving is super-cheap gasoline, or, more precisely, the precipitous drop in U.S. gasoline prices since 2014.
The nationwide average pump price was $3.43 in 2014, the fourth consecutive year in the mid-three dollar range. It dropped nearly a dollar in 2015, to $2.51, and fell again in 2016, to $2.20. Adjusted for general inflation (which is how we economists calibrate these things), the 2014-2015 price drop was 26.8%, and the 2015-2016 drop was 13.3%. The two-year real fall in price, 37%, is the largest over two consecutive years since at least 1950.
A drop in gasoline prices would cause an uptick in driving. If it’s cheaper to drive a mile, or 100 miles, it stands to reason that people will drive more miles. But how much more? How sensitive is the amount of miles driven (VMT) to the price of gasoline? Or, more precisely, how sensitive are changes in VMT to changes in the price of gas?
The answer: the relationship between VMT and gas prices isn’t super-sensitive; but it’s more than zero, and enough to make a big difference in the amount of driving when gas prices take a large turn.
Let’s look at how the math works. The parameter we’re looking for is the gasoline price-elasticity of VMT (driving). Let’s say it’s negative 0.1. (Negative because a lower price means more driving; and just 0.1 because the connection is probably slim.) Now let’s say the price of gasoline drops by one-fourth, or 25%. Based on the assumed -0.1 price-elasticity, we would expect a 3% rise in driving. (Mathematically, that’s because 0.75 raised to the negative 0.1 power, written as 0.75^(-0.1), is 1.029, which denotes a 2.9% increase.)
Does that feel right? Would a one-fourth drop in the price of gas — not just over a single day or month, but over a sustained period — actually lead people to drive 3% more? Would people take more car trips, or longer trips, to that extent? It seems reasonable that they would, though how much is an empirical question. (Which is why the entire vast literature on price-elasticities is based on observed behavior.)
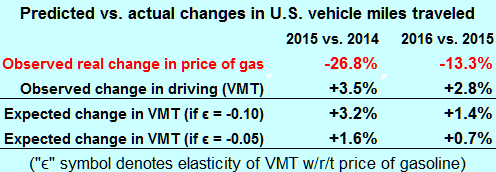
Biggest factor in VMT rise: probably steep drop in price of gas.
In the table at right I’ve run the actual drops in the price of gas through that calculation, for two possible VMT price-elasticities: (negative) 0.10, and half that value, or 0.05. For the 0.10 value, the drop in the price of gas would have evoked much or most of the observed rise in driving. For the lower 0.05 value, not so much but still a significant portion. (The influence for 2016 should actually have been greater than shown because of the lagged effect from the 2015 price drop.)
What, then, are the best estimates for the price-elasticity in the literature (again, we’re looking for the change in VMT as a function of changes in the price of gasoline)? For the past decade I’ve relied on a seminal 2007 paper by U-C Irvine transportation economists Ken Small and Kurt Van Dender in which they derived a long-run price elasticity of gasoline consumption for the U.S. of -0.38, with 46% of that being due to changes in the amount of vehicle travel. Multiplying those two figures yields a long-run elasticity of VMT with respect to the price of gasoline of -0.175.
(The Small – Van Dender paper is summarized on CTC’s Effectiveness page — drop down to the first bullet point. The paper, “Fuel Efficiency and Motor Vehicle Travel: The Declining Rebound Effect,” is available here. The result just given appears on p.24 (FN 27). Small and Van Dender also remark that the 46% share of gasoline price elasticity accounted for by VMT declined to 27% when recalibrated to prices and driving behavior observed toward the end of their sample period. It’s also true that their elasticity figures are long-run, whereas the VMT behavior we seek to explain here is short-run, implying a still-lower price-elasticity; on the other hand, when the price of gas changes it’s easier to change the amount of driving quickly than to change miles per gallon, which suggests that the short-run elasticity of VMT might not be many times smaller than the long-run figure.)
My takeaway is suggested by the table above: while numerically the gasoline price-elasticity of VMT is small, the fall in gas prices in 2015 and 2016 was so severe that it almost certainly explains a lot of the observed rise in driving. Of course, rising incomes would also have played a role, but likely a small one. The Small – Van Dender income-elasticity of driving is 0.11 in the short run and 0.53 in the long run. Assuming a value of 0.25 for our purposes, the 2.6% increase in real GDP from 2014 to 2015 would have been expected to evoke only a 0.6-0.7% increase in driving (since 1.026 raised to the 0.25 power is 1.0064); for the 1.6% rise in GDP from 2015 to 2016, the effect on driving would have been smaller still.
What does this exercise suggest about carbon taxes? Take it as yet one more demonstration that prices influence the level of usage of just about everything, including fuels, energy, even driving. The price sensitivities (elasticities) may not be enormous, but they are felt nonetheless. In 2015 and 2016 they were enough to power a record two-year rise in total U.S. miles driven. And they’ll also act in reverse, which is how a carbon tax — particularly one with a rising price trajectory that can filter out market volatility — can be so powerful in slashing gasoline use and fossil fuel use generally.
And remember, the price elasticity of gasoline use (and its carbon emissions) is at least twice as great as the elasticity of driving with respect to the price of gas, which is what we’ve explored here. (We explored the price elasticity of gasoline in this Sept 2015 post, which is one of our most-viewed ever.)
So when you see someone parading false facts like this one on the New York Times letters page earlier this month,
[F]act — as documented by the Energy Information Administration and experienced by anyone who must drive regularly regardless of cost — fuel prices have little effect on gas consumption. (The letter, from Food & Water Watch, is the third of five in that link.)
you’ll know how to push back.
A Way Forward for Carbon Taxes
Here we cross-post my article published in The Nation magazine this morning, under the headline, Progressives Need to Get Over Themselves and Support This GOP-Backed Carbon-Tax Plan. Except for a few extra links below, the two versions are the same.
To stay up to date on carbon tax policy, politics and economics, join our email list, click here.
— Charles
Carbon tax haters can relax. The proposal for a national carbon tax released on February 8 by high-level Republicans, including uber-GOP consigliere James Baker, isn’t going anywhere. Financially and ideologically, the American right is wedded to carbon fuels. Trumpism runs on and reeks of them. Predictably, not a single Republican in Congress, and no one in the White House, has uttered a single positive word about the new carbon tax plan.
Nevertheless, the proposal’s intended audience may not be Beltway Republicans, but rather those ordinary Americans, majorities in both parties, who say they want action on climate, and who therefore might yet figure in the political equation over climate policy. That group includes progressives. We should pay attention: Carbon taxes matter.
 Our long-building climate crisis is already materializing as drowned coasts, punishing droughts, vanishing glaciers—and political upheaval. At its root is a century-old lie: market prices for gasoline and other fossil fuels that do not factor in the damage from burning them.
A clean energy revolution is at last underway, with wind power, solar electricity, and energy efficiency becoming not only cheaper by the day, but easier to deploy. Still, the clean energy transition will be slowed until prices of coal, oil, and gas reflect their true environmental costs. A carbon tax could do that, if designed properly.
How carbon taxes work is simple enough, at least in theory. Fuel use is infinitely varied and intricately woven into society in ways that regulations such as auto mileage standards can’t fully reach. Clear price signals, on the other hand, can be a nearly magic wand to help billions of invisible hands rapidly reduce and replace fossil fuels.
But with a carbon tax come difficult choices about the vast revenue it will generate. Carbon taxing had a test run at the ballot box last November in the state of Washington, and it ended badly.
On November 8, voters in the Evergreen State rejected by a nearly 3-to-2 margin what would have been the nation’s first statewide carbon tax. A win for “Initiative 732” would have given the United States a carbon tax beachhead, like Canada’s British Columbia, which has had a small but successful carbon tax since 2008.
Remarkably, the decisive factor in defeating I-732 may not have been money from big carbon or even popular aversion to higher taxes, since the initiative was tailored to keep Washingtonians’ tax burden unchanged. What doomed I-732 was a fissure within the climate movement, with centrist economists and other policy wonks in favor of the initiative and progressive greens opposed.
Stated briefly, climate activists in Washington split over opposing answers to two key questions: What are carbon taxes for, and who gets to design them?
Carbon taxes can cut emissions in two ways. As noted above, they raise the price of carbon fuels, thereby worsening their competitive position vis-à-vis cleaner fuels. In addition, the tax revenues raised by a carbon tax can be invested in clean energy infrastructure such as public transit and community solar.
The first path—the “price pull” of boosting market prices of carbon fuels—is what dazzles economists. The second route—the “revenue push” of investing in green infrastructure—appeals to many ordinary folks, especially on the left. Some progressives actively distrust policies that lean hard on price signals, partly for fear that workers in dirty industries will be penalized as investment migrates to cleaner alternatives.
For decades, reactionary forces in the US have been able to block seemingly every new public endeavor by labeling it tax-and-spend. The Washington state carbon tax proponents believed they had an antidote: don’t allow the government to spend the revenues from the carbon tax; rather, use those revenues to reduce other taxes. The political assumption seemed to be that going “revenue-neutral,” though it might frustrate the left—bye-bye public investment—could placate the right or at least capture the center. And so Carbon WA, as the advocates of I-732 called themselves, fashioned its ballot initiative around cuts to the state’s regressive sales tax.
Progressive greens recoiled. The Alliance for Jobs and Clean Energy, a state umbrella group of environmental justice organizations and mainstream allies, blasted I-732 for starving green jobs and ignoring frontline communities. So did nationally prominent progressive leaders like Naomi Klein and Van Jones. The measure’s electoral chances, which were never good, could not withstand this split. On election day, as Hillary Clinton was besting Trump in Washington state by half-a-million votes, the carbon tax was rejected, 59 percent to 41 percent.
But progressives can’t just walk away from carbon taxes. Carbon taxes are the only policy tool that, by slashing demand in a rapid, predictable way, divests our economy from fossil fuels and enables governments, business and consumers to make investments in the transition to clean energy. Carbon taxes also have the best chance of catching fire globally.
The carbon tax James Baker brought to the Trump White House on February 8 on behalf of the new Climate Leadership Council has a lot in common with I-732: the Council’s proposal is also avowedly revenue-neutral. But rather than lowering an existing tax, it relies on a so-called tax-and-dividend model: as the state of Alaska does with oil revenues, revenues from the Council’s national carbon tax would be returned equally to all American households in quarterly “dividends” digitally deposited in Social Security accounts. The tax would start at $40 per ton of carbon dioxide.
Earmarking all of the revenue to these dividends creates the political will to raise the tax every year, since the dividends rise in tandem with the tax rate. Ramping up the tax by $5 a year would shrink the use of carbon fuels so drastically that, by my calculations, US carbon emissions in 2030 would be 40 percent less than they were in 2005 (a standard baseline year).
Yet this progress comes with a catch. The Council would phase out much of the Environmental Protection Agency’s regulatory authority over greenhouse gases and would outright repeal President Obama’s Clean Power Plan to cut emissions from electricity generation. It would also immunize fossil fuel companies from lawsuits for damages done by their products—lawsuits such as those bound to arise from the revelations that ExxonMobil and other companies knew for decades about the climate damages their products cause, and lied about it.
 But government policy revolves around trade-offs, and on balance the Council’s carbon tax is worth supporting. After all, well over 80 percent of the Clean Power Plan’s targeted reductions for 2030 were already achieved by the end of 2016. Thus trading away the Clean Power Plan for a tax that could scour fossil fuels from the entire economy is like swapping an aging ballplayer for the next superstar.
Of course, not everyone will see it that way, particularly traditional green groups that helped write the laws and regulations that cleaned up the nation’s air and water. Some will regard the Council’s trade as a ploy to undo the EPA’s authority to protect not just climate—where it may be largely ineffectual anyway—but public health.
With Republicans tightly lashed to climate denial, the value of Baker’s carbon tax proposal may be less as a gateway to legislation and more as a spur for progressives and other citizens to take a clear look at carbon pricing.
Will progressives trust the verdict of economists that a revenue-neutral carbon tax can drive the energy transition so long as the tax level is high enough? Or do we support carbon taxes only if the revenues are invested in the clean energy transition? If so, how do we craft a spending program that reconciles the claims of competing interests? And what is our blueprint for building political power to enact such a carbon tax, when “tax” remains a dirty word in national politics?
Clear majorities of Americans want climate action. Remarkably, some polls have even found that majorities of Americans support carbon taxes like the Climate Leadership Council’s proposal. With the Democrats’ national defeats last November, the failure of climate activists to unite on the Washington state referendum is looking like an unforced error of cruel proportions. We can’t afford to repeat that mistake at the national level.
Carbon Tax Center Backs Climate Leadership Council’s Carbon Tax Proposal
February 8, 2017, 9:30 a.m. • For Immediate Release
The Carbon Tax Center voiced strong support this morning for a proposal by the Climate Leadership Council to enact a comprehensive nationwide carbon tax starting at $40 per ton of carbon dioxide and rising over time.
The Council is scheduled to release its proposal, “The Conservative Case for Carbon Dividends,” at the National Press Club this morning, Wednesday, Feb. 8, at 9:30 a.m.
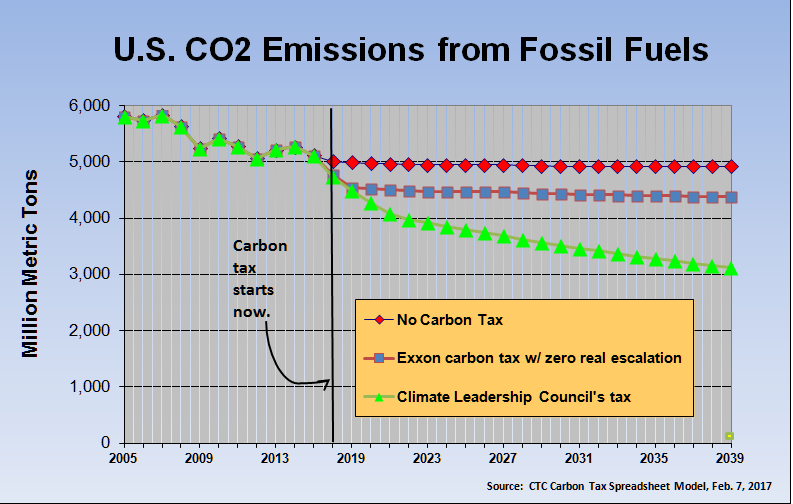
Modeling by the Carbon Tax Center suggests that a $40/ton carbon tax starting in 2018 and rising by $5/ton each year would, by 2030, reduce U.S. emissions by 2.3 billion metric tons from 2005 level.
A $40 per ton tax on carbon pollution starting in 2018 and rising thereafter by $5 per ton each year would, by 2030, reduce annual U.S. CO2 emissions from levels in 2005 (a common baseline year) by an estimated 2.3 billion metric tons, a 40 percent reduction.
Alternatively, measured against a moving “business as usual” trajectory with no national carbon price, the 2030 reductions would be 1.4 billion metric tons a year, or nearly 30 percent of unpriced emissions projected for that year.
(The Council’s proposal envisions that “A sensible carbon tax might begin at $40 a ton and increase steadily over time.” We chose $5/ton as a politically palatable annual rate of increase, and modeled such a tax using our carbon tax model.)
“The robust carbon tax proposed by the Climate Leadership Council would vault the U.S. from the middle to the head of the global pack in reducing heat-trapping, climate-damaging emissions,” said Carbon Tax Center director Charles Komanoff. “It would also provide a template for other nations to follow, creating a real possibility of keeping the rise in global temperatures to 2 degrees Centigrade or less,” Komanoff said.
Using CTC’s model, Komanoff calculated that the future emissions reduction rate with the Council’s carbon tax would surpass by 50 percent the actual reduction rate since 2005, “a major achievement,” he said, “given that the past reductions were largely enabled by eliminating much coal-burning – the lowest-hanging fruit in eliminating carbon.”
CTC also endorsed the political “swap” in the Council’s proposal to rescind the Obama administration’s Clean Power Plan. “The important work of the Clean Power Plan was largely completed anyway,” said Komanoff, pointing out that well over 80 percent of the plan’s targeted reduction in electricity-sector emissions for 2030 had already been achieved by the end of 2016. “The proposed carbon tax is the logical and necessary next step,” he said, “instilling incentives throughout the U.S. economy to replace fossil fuels with clean energy.”
CTC further endorsed the Council’s proposal to “dividend” the carbon tax revenues to U.S. households on a quarterly basis. “We’ve studied ‘fee-and-dividend’ for years, and can vouch that it’s the most equitable, least bureaucratic and least corruptible way to distribute the hundreds of billions of dollars of revenue from a carbon tax, while also generating jobs,” Komanoff said.
Komanoff sounded a cautionary note about the dogged resistance of Congressional Republicans to climate action, but added that the Council’s proposal hits all the right marks for a business-friendly, small-government climate policy. “Republicans looking for a way out of their denialist, obstructionist stance on climate have been handed a lifeline,” he said. “Their children and grandchildren are counting on them.”
# # # # # # # #
About CTC: Since 2007, the Carbon Tax Center has stood at the front lines of the struggle for a sustainable climate and a habitable Earth. Our mission: to generate support to enact a transparent and equitable U.S. carbon pollution tax as quickly as possible — one that rises briskly enough to catalyze virtual elimination of U.S. fossil fuel use within several decades and provides a template and impetus for other nations to follow suit.
Shoot Out The Lights?
Years ago, my friend Vince built a house on a hillside in Vermont, a mile or so from the town where he grew up. The deck looked out on the valley and, at night, to a dark sky filled with stars. Then a couple from Montreal, weekenders, put up an A-frame in the valley, with an outdoor light that obliterated the darkness. When they drove back to the city on Sundays, the light stayed lit.
Vince had a choice: try to reason with the couple, or direct action. It was either-or, since talking with them would blow his cover. He chose direct action: One Monday evening he drove over with a ladder and unscrewed the bulb. Evidently the couple didn’t take the hint, since the light went back on the next weekend. The following Monday, Vince returned with a friend, who brought his shotgun. The light went off and stayed off.
From Feb 5 NY Times etiquette column, under heading ‘Waste of Energy.’
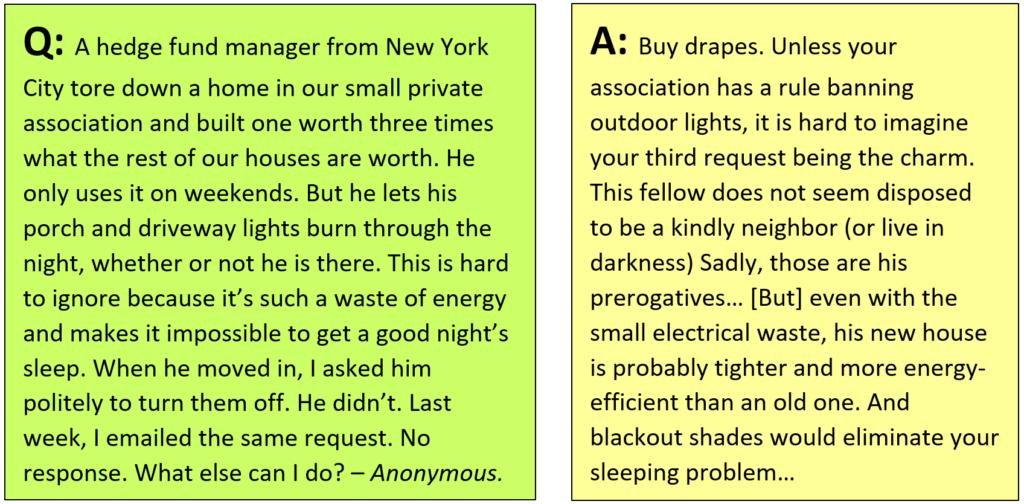
What brought this episode to mind was the letter in the Sunday NY Times’ etiquette column, Social Q’s, shown at left, about a glaring light in a homeowners’ association. The letter-writer bemoaned the waste of energy rather than the loss of dark sky. But chalk one up for Vince from Vermont; reasoning didn’t avail, leaving the letter-writer to suck it up and “buy drapes.”
A small, sad story. Of greater interest is what the columnist said — and neglected to say — in response, about energy, climate and the social compact.
The columnist rationalized the hedge fund manager’s waste of electricity by citing the advance of energy efficiency. New homes, indeed new everything, from appliances and computers to automobiles and aircraft, are required to be more energy-efficient — the result of a hard-won societal decision to build efficiencies into product design rather than leave them to an energy marketplace whose prices don’t fully reflect environmental costs. The point of energy standards is to bridge those marketplace gaps, not provide an excuse for unfettered waste.
And think about how much energy usage has to be eliminated to meet even the most basic climate targets. Running in place doesn’t pass muster when carbon emissions need to shrink 80 percent by 2050 if not much sooner. We’ve run out of room for backsliding.

Milky Way. Photo by Hans Braxmeier, via Pixabay.
I’ll bet the letter-writer gets that. To her, the waste of electricity probably goes beyond the btu’s and CO2. It’s a signifier of the neighbor’s heedlessness. Though he’s not legally required to have climate-consciousness, it’s frustrating that he apparently doesn’t. Making things worse, there’s no carbon tax. While a stiff carbon emissions charge might not change the neighbor’s behavior, our letter-writer might gain a measure of satisfaction from knowing that the neighbor’s heedlessness is adding to tax revenues.
The columnist’s reply also ratifies our asymmetrical social compact: it’s the neighbor’s prerogative to light up the night, and the letter-writer’s responsibility to deal with the damage. The same social compact lets helicopter users and jet-skiers destroy quiet enjoyment of the world for the rest of us. Go ahead and spew unwanted light, unwanted sound, unwanted greenhouse gases; we’ll put up with the damage.
The columnist didn’t suggest collective action. Shouldn’t the letter-writer talk to other neighbors and try to organize them? Okay, maybe that’s futile, or maybe she risks being labeled a crank or squandering social capital she might need for some bigger concern. And there are only so many hours in the day.
The moral: in energy and climate, as in anything, there are norms at play. As I pointed out years ago, in my post, No Magic Price Point for Kicking Carbon, so much energy use that we think is necessary or natural is actually socially determined. Cheap energy has engendered a culture of conspicuous usage and waste. A carbon tax could help dismantle that, and undo much of the ingrained consumption that gets under our skin.
The No-Brainer Pollution Tax
Think global, act local. I had that seventies slogan in mind last Sunday morning, at home in lower Manhattan. The pro-immigration rally in Battery Park was a few hours away, the sun was shining, and I walked around the corner to meet up with Erik Torkells, editor of the neighborhood blog, Tribeca Citizen.
 Erik had a bag-snagger — a telescoping grappling hook for pulling plastic bags off tree limbs. Like many New Yorkers, he can’t abide the bags and other gossamer debris stuck, like tumors, to our half-a-million street trees. The contraption cost 400 bucks, and when he drew it from its canvas bag I could see why: it had four extenders, a fancy clamp or two, and a fearsome business-end worthy of a stevedore.
Bag snagging, I quickly learned, is serious business. Time-consuming, too. Over the next hour-and-a-half, and even with a big assist from my pal Rachel, who was passing by and gamely joined our little crew, Erik and I could only untangle a few dozen derelict bags from as many trees. And sad to say, we snapped a few spindly tree limbs in the process. (After we posted this, Erik put up a detailed account, Adventures in Bag Snagging; it’s obsessively terrific.)

Author bag-snagging in Tribeca.
If only there were a way to keep the bags out of the trees in the first place!
There is, of course, and that’s the main reason I went bag-snagging on Sunday, and why I’ve posted this piece as a Carbon Tax Center blog.
Beginning in February, a NYC local law enacted last spring — Local Law 63 of 2016 — will attach a nickel fee to carryout bags dispensed at supermarkets, grocery and convenience stores, and pharmacies. Shoppers who bring their own bags with them are of course exempt from the charge. Similar fees in dozens of U.S. cities, including San Jose, CA and Washington, DC, have curbed distribution of store bags by over two-thirds, reducing bag litter in gutters, streams and, yes, trees, and saving municipalities millions in trash collection and disposal.
Here in New York, however, implementation of the law was suspended to allow time for, er, more arguing. And now a last-ditch effort to pre-empt the law threatens to undo it before it can get started.
The connection to carbon taxing isn’t so much the petroleum waste from single-use bags, as the principle of charging a fee to encourage efficiency and conservation. To opponents, the fee smacks of punishment. To supporters, it’s a simple prod to finally do what our counterparts in Europe have been doing without grumbling for a century: keep a string or cloth bag with you to stick the groceries in.
In a way, the bag fee fight is the carbon tax struggle stripped to its essence: both policies internalize some of the cost of the harm in its price to incentivize less use. If anything, the bag fee is even more of a no-brainer. There’s no demonstrable burden on the poor. (The NYC law exempts food-stamp users.) There are no shut coal-mines to fret over, no analog to the low-wage worker forced to drive hours each day between two jobs. “You say you use twenty bags a week? Fine, bring your own!”
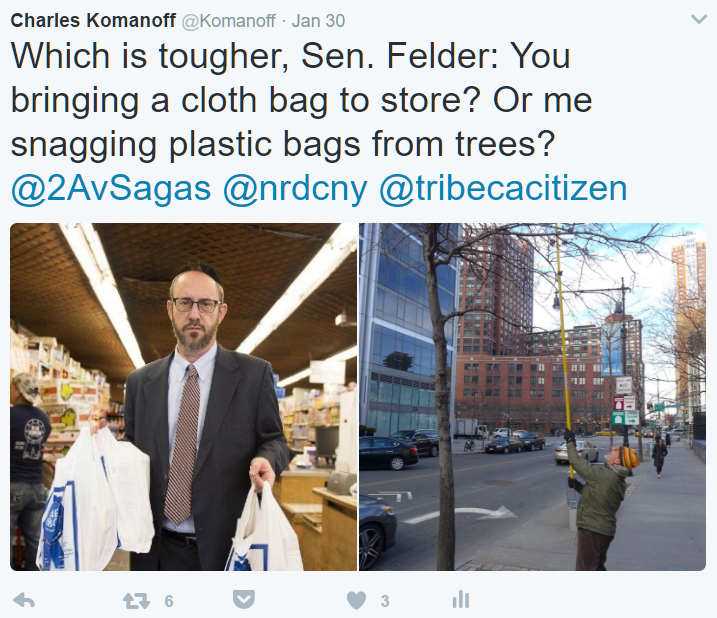
State Senator Simcha Felder calls the nickel bag fee a ploy to “shake New Yorkers own every time they shop just for the privilege of using a plastic bag.”
Sadly, that logic hasn’t worked on a handful of legislators. Perhaps they can’t make the imaginative leap to picture the simple but permanent behavior change. Or maybe they look upon the bag fee as an affront. Either way, the anti-fee forces might actually carry the day. Their repeal bill has cleared the NY State Senate, and now only the Assembly and the Governor stand in the way.
Why fight for the fee when a megalomaniacal demagogue in the White House is persecuting immigrants, refugees and Muslims and preparing to blow up the Paris climate accord? That one’s simple. The battles aren’t either-or, they’re both-and. We can progress on multiple fronts. Later that Sunday, my wife and I rallied with over 10,000 other New Yorkers in Battery Park, against the new administration.
Earlier this month, the New York Times asked Jennie Romer, the activist founder of Plastic Bag Laws, to comment on the rollback effort in Albany. “It seemed to be a very simple incremental policy to make real environmental change,” she told the Times. “And it has turned out to be an incredibly difficult fight.”
Yes, even seemingly incremental progress can be hard as hell. Still, we don’t stop.
If you’re a New York State resident, click here to find your Assemblymember’s contact info.
Bag-snagging photos by Erik Torkells.
- « Previous Page
- 1
- …
- 22
- 23
- 24
- 25
- 26
- …
- 170
- Next Page »
