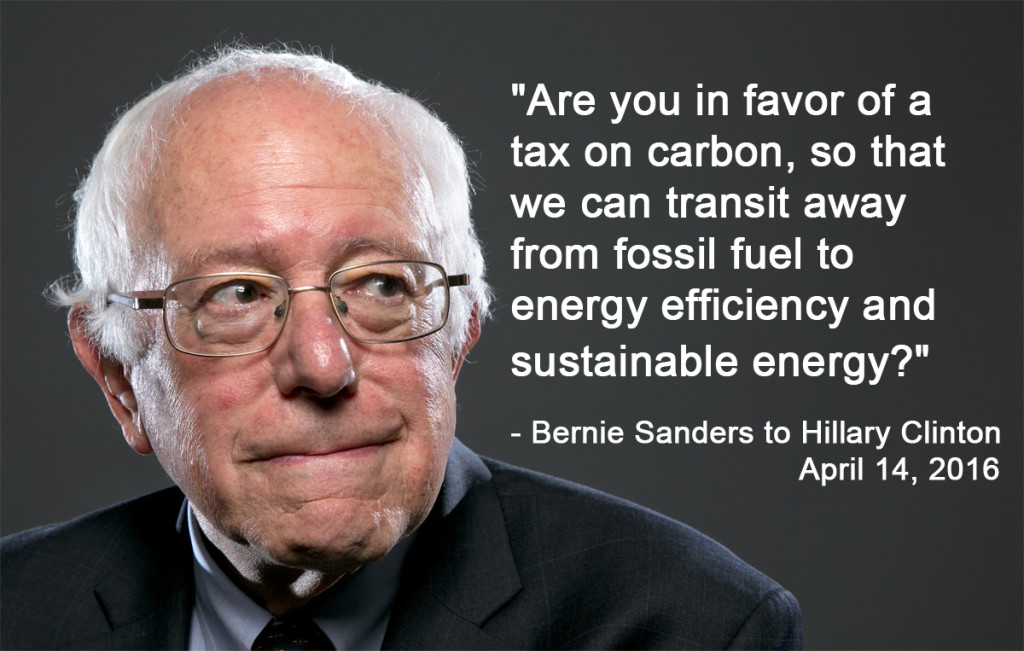
Chantal Hebert, Toronto Star national affairs columnist, in Conservatives are rethinking the party’s stance on carbon pricing, March 8.
China Emissions Will Peak Soon (If They Haven’t Already): New Study
The acclaim that greeted China’s pledge in November 2014 to cap its carbon emissions by 2030 was broad yet hesitant. The promise by the world’s Number One emitter to halt the explosive growth in its climate pollution was momentous. But deferring the ceiling to 2030 meant emissions could continue climbing for 16 years, perhaps doubling, on top of the tripling recorded during 2000-2013.
We at CTC chose to see the glass as half-full, and wrote at the time:
Though China’s emissions can still grow in the intervening decade-and-a-half, its cap pledge virtually ensured that its rate of emissions growth would begin bending downward before 2030, on account of the lead time needed to overcome the “inertia” built into the factors that collectively determine emission levels. Moreover, the commitment from Beijing conferred instant legitimacy on political forces within China favoring clean energy and seeking relief from relentless air pollution that kills an estimated 1.6 million Chinese a year.
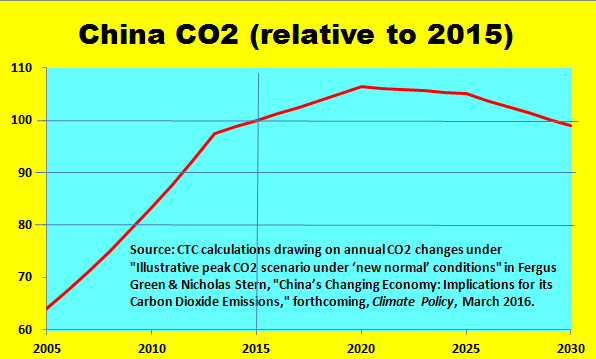
Our optimism has now been amplified, in spades. An analysis released this week, soon to be published in Climate Policy, forecasts that China’s CO2 emissions from fossil fuel combustion may peak as early as 2020 — a full decade before the cap target year. Moreover, rather than shooting past earlier benchmarks, emissions in 2030 would be 7 percent below the 2020 peak and even 1 percent under last year’s emissions, according to the forecast. Such a turnaround would exceed all but the most buoyant expectations that greeted the 2014 announcement and would raise the bar for the U.S. and the other 190 nations that submitted emission pledges at the U.N. climate summit in Paris in December.
This upbeat analysis comes from two of the world’s most prestigious climate think tanks: the Centre for Climate Change Economics and Policy, and the Grantham Research Institute on Climate Change and the Environment, both based in London. The authors are Fergus Green, a climate policy consultant from the London School of Economics; and Sir Nicholas Stern, director of the Grantham Institute and arguably the world’s most renowned climate economist.
The premise of the Green-Stern paper is evident in its title: “China’s Changing Economy: Implications for its Carbon Dioxide Emissions.” China’s economy is undergoing a pronounced transition, say the authors, and the implications for energy use and carbon emissions are profound:
The period 2000-2013, it is now clear, was a distinct and exceptional phase in China’s developmental history, during which the very high levels of greenhouse gases emitted were linked closely with the energy-intensive, heavy industry-based growth model pursued at that time. China is currently undergoing another major structural transformation — towards a new development model focused on achieving better quality growth that is more sustainable and inclusive.
During that 2000-2013 period, China’s primary energy consumption grew at a compound annual rate of more than 8% a year. In 2014, in contrast, primary energy consumption grew from 2013 by just 2.2%, and last year’s year-on-year increase through September was less than 1%. The “new development model,” which the authors date from the start of 2014, entails a marked decline in heavy industry’s share of GDP, with output of steel and cement, production of which is extraordinarily energy-intensive, actually falling in the first half of last year.
“These structural changes,” assert the authors, “are occurring on top of ongoing energy conservation initiatives within industry and other sectors [leading to] strong declines in the energy intensity of GDP over the last two years . . . at the same time as GDP growth slowed significantly.” Concurrently, non-fossil electric generation capacity underwent a veritable explosion, from 257 gigawatts in 2010 to 444 GW in 2014.
The motive forces behind this upsurge ― the air pollution crisis, the problematic rise in fuel imports, and the government’s prioritization of zero-carbon power sources as loci of innovation in global markets ― seem certain to endure. Meanwhile, industrial consumption of coal, which Green and Stern say accounts for half of China’s coal usage, appears to be falling as well, not just because steel and cement output are dropping but because production processes are finally becoming more efficient.
Another factor pointing to lower economic and energy growth going forward, say Green and Stern, is “China’s excess capacity in construction and heavy manufacturing.” In effect, part of the past huge growth in fuel use and emissions was an artifact of stockpiling industrial capacity that no longer needs to be expanded, they suggest. Moreover, they assert, “The structural nature of the turnaround in these industries is now widely recognized throughout the Chinese government and the industries themselves. Accordingly, the prospects for declining investment, rationalization and falling production across such sectors in the context of China’s new development model now appear strong.”
The upshot is two-fold: first, a lesser rate of GDP growth going forward; second, a continuation of recent declines in the energy intensity of GDP. According to the authors, the primary energy required to produce a unit of economic output fell by nearly 4 percent a year during 2005-2013, and they believe this decline rate can continue indefinitely. They also point to China’s 2020 targets of as much as 300 GW of wind capacity and 150 GW of solar (the latter revised last fall from 100 GW), along with lesser but still sizeable amounts of new nuclear capacity. Even coal-fired power generation is ripe for greater efficiencies, say Green and Stern, as older and less-efficient plants are replaced by newer ones able to wring more kWh’s from the same Btu’s.
Needless to say, maintaining and extending these positive trends won’t be painless, especially in light of ongoing expansions of coal-fired capacity — “despite already enormous amounts of excess capacity” — that have pushed utilization rates for coal-fired power plants below 50%. The authors identify three policy imperatives:
- Rein in expansion of new coal infrastructure in electricity and industry;
- Institute “green dispatch” that prioritizes non-fossil generation over fossil generation, and more efficient fossil generators over less efficient ones;
- “Increase effective carbon prices on fossil fuel energy sources, especially coal.” “Effective carbon pricing,” write Green and Stern, “would alter the economics on the supply-side in ways that would disadvantage high-carbon generators and support green dispatch. A rising coal tax would be a highly efficient and administratively effective measure, well-suited to China’s institutional context, though a well-designed and implemented emissions trading scheme operating in the electricity sector could in theory achieve similar results.”
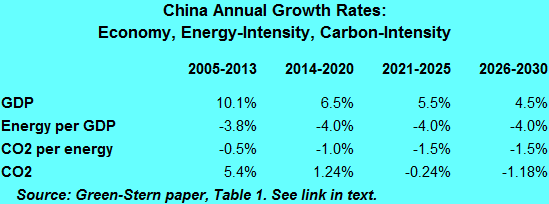
Green and Stern see CO2 emissions peaking “at some point between 2014 and 2025, depending on how the above factors play out.” A table in their paper (summarized above) presents recent-historical (2005-2013) growth rates for GDP, the energy intensity of GDP, and the CO2 content of each unit of primary energy; and possible future growth rates for each for three future periods: 2014-2020, 2021-2025, and 2026-2030. Resulting future CO2 growth rates are then:
- 1.24% per year for the current period;
- negative 0.24%/year for 2021-2025, owing to assumed 1% slower GDP growth and a 0.5% per year acceleration in the decarbonization of energy;
- negative 1.18%/year for 2025-2030, due to a further assumed 1% per year drop in GDP growth.
Emissions would be massively less than near-universal expectations from just 18 months ago. Yet China can and must do even better. The third Green-Stern policy recommendation, to “increase effective carbon prices,” is key. With robust carbon pricing in place, even the optimistic new scenario from Messrs. Green and Stern could soon come to be regarded as conservative.
Sir Nicholas Stern: Current climate models are grossly misleading
This fall marks the tenth anniversary of the Stern Review, the 700-page report to the U.K. government on the economics of climate change by a team headed by economist Nicholas Stern, who was then chair of the Government Economic Service. The report famously called climate change the greatest market failure in human history and argued persuasively that the costs of climate inaction would grossly outweigh any possible benefits, even assuming high returns from monies not expended in the near term to arrest climate change.
Lord Stern — he received a life peerage in 2007 — currently directs the Grantham Research Institute on Climate Change and the Environment at the London School of Economics. Last week he published an editorial in Nature, Economics: Current climate models are grossly misleading, in which he argues emphatically that climate damage models — which translate postulated global temperature increases into societal and environmental costs — are grossly biased toward undercounting costs.
The editorial builds on research by Lord Stern and colleagues at Grantham that we reported on two years ago. In a nod to Lord Stern’s prominence and the importance of climate-damage modeling, we reprint it here in full. — C. Komanoff
The twin defining challenges of our century are overcoming poverty and managing climate change. If we can tackle these issues together, we will create a secure and prosperous world for generations to come. If we don’t, the future is at grave risk.
Researchers across a range of disciplines must work together to help decision-makers in the public, private and non-profit sectors to rise to these challenges. Economists, in particular, need more help from scientists and engineers to devise models that provide better guidance about what will happen if we succeed or if we fail.
As the 2015 Paris agreement on climate change made clear, we must achieve a net-zero carbon economy this century. Doing so will require policies that drive innovation, investment and entrepreneurship. The political will to make the necessary decisions depends partly on improving the analysis and estimates of the economics of climate change. Then the consequences of unmanaged global warming can be weighed much more transparently against the investments and innovations necessary to mitigate it.
Current economic models tend to underestimate seriously both the potential impacts of dangerous climate change and the wider benefits of a transition to low-carbon growth. There is an urgent need for a new generation of models that give a more accurate picture.
Dark impacts
The Fifth Assessment Report of the Intergovernmental Panel on Climate Change (IPCC), published in 2013 and 2014, provided a comprehensive overview of the literature on the costs of action and inaction. But the assessment understated the limitations of the research done so far. Essentially, it reported on a body of literature that had systematically and grossly underestimated the risks of unmanaged climate change. Furthermore, that literature had failed to capture the learning processes and economies of scale involved in radical structural and technical change, and the benefits of reducing fossil-fuel pollution, protecting biodiversity and forests, and so on.
The IPCC pointed out1 that estimates of losses resulting from a 2 °C increase in mean global temperature above pre-industrial levels ranged from 0.2% to 2% of global gross domestic product. It admitted that the global economic impacts are “difficult to estimate” and that attempts depend on a large number of “disputable” assumptions. Moreover, many estimates do not account for factors such as catastrophic changes and tipping points.
It is these hard-to-predict impacts that are the most troubling potential consequences of inaction. The next IPCC report needs to be based on a much more robust body of economics literature, which we must create now. It could make a crucial difference.
Many estimates of economic losses are based on the outputs of integrated assessment models (IAMs). These models attempt to combine the key elements of biophysical and economic systems. This is a worthy endeavour. Sadly, most IAMs struggle to incorporate the scale of the scientific risks, such as the thawing of permafrost, release of methane, and other potential tipping points. Furthermore, many of the largest potential impacts are omitted, such as widespread conflict as a result of large-scale human migration to escape the worst-affected areas.
For instance, there is evidence that temperature increases of 1.5 °C and 2 °C would lead to differing extents of sea-level rise and extreme weather events2, with obvious implications for small island states and coastal communities. These differences are simply not represented in the flawed estimates of economic losses.
IAMs are also used to calculate the social cost of carbon (SCC). They attempt to model the incremental change in, or damage to, global economic output resulting from 1 tonne of anthropogenic carbon dioxide emissions or equivalent. These SCC estimates are used by policymakers in cost–benefit analyses of climate-change-mitigation policies.
Because the IAMs omit so many of the big risks, SCC estimates are often way too low. As a first step, the consequences being assessed should include the damages to human well-being and loss of life beyond simply reduced economic output. And the very large uncertainty, usually involving downward bias, in SCC estimates should always be made explicit.
As the IPCC acknowledged2, published SCC estimates “lie between a few dollars and several hundreds of dollars”. These values often depend crucially on the ‘discounting’ used to translate future costs to current dollars. The high discount rates that predominate essentially assume that benefits to people in the future are much less important than benefits today.
These discount rates are central to any discussion of our hand in the fate of future generations. Most current models of climate-change impacts make two flawed assumptions: that people will be much wealthier in the future and that lives in the future are less important than lives now.
The former assumption ignores the great risks of severe damage and disruption to livelihoods from climate change. The latter assumption is ‘discrimination by date of birth’. It is a value judgement that is rarely scrutinized, difficult to defend and in conflict with most moral codes.
Costing transition
The other role of IAMs — to estimate the costs of climate-change mitigation — also suffers from major shortcomings.
The IPCC’s mitigation assessment3 concluded from its review of IAM outputs that the reduction in emissions needed to provide a 66% chance of achieving the 2°C goal would cut overall global consumption by between 2.9% and 11.4% in 2100. This was measured relative to a ‘business as usual’ scenario. Clearly, growth itself can be derailed by climate change from business-as-usual emissions.
So the business-as-usual baseline, against which costs of action are measured, conveys a profoundly misleading message to policymakers that there is an alternative option in which fossil fuels are consumed in ever greater quantities without any negative consequences to growth itself.
Crucially, IAMs generally omit the potentially huge costs of air pollution from fossil fuels — which are saved if alternative fuels are used4. IAMs struggle to describe developments in alternative energy. They fail, in general, to capture the feedback loops in the innovation process that interact across the economy, prompting institutional and behavioural change, possible discoveries and economies of scale. There is empirical evidence, for example, that the geographical location of researchers and inventors can affect whether a firm chooses to do clean or dirty innovation.
“Discount rates are central to any discussion of our hand in the fate of future generations.”
The initial investment required to catalyse the transition to a low-carbon pathway might lead to great economic benefits in the long run. These could go well beyond avoided climate risks5. The knowledge spillover from low-carbon innovation into the wider economy — for instance, a battery developed for electric vehicles being used in wheelchairs — seems to be greater overall than that from high-carbon-energy technologies6.
As engineers learn how to install, connect and repair technology cheaply, unit costs fall faster for many new technologies than for existing ones. This has already allowed solar-photovoltaic and onshore-wind technologies to become competitive with natural gas and coal in several locations, even without emissions taxation.
Also influential will be the emergence of new networks, such as the integration of electric-vehicle-energy storage into smart grids, as well as rapid technical progress. And these steps can be accelerated if, for example, consumers change behaviour and demand support for resource efficiency, recycling and pedestrianization. It is clear that much will depend on urban management and design; as cities grow rapidly, damaging infrastructure can become ‘locked in’.
What’s needed?
There is much that can be done to make the assumptions in standard IAMs more realistic with respect to the scale and nature of damages7, 4. But to give policymakers the reliable information that they need when implementing the Paris agreement, incremental improvements7, 8 to the present generation of IAMs may not be enough.
A comprehensive review of the problems of using IAMs in climate economics5 called for the research community to develop a “third wave” of models. The authors identify various types of model that might offer advances. Two are: dynamic stochastic computable general equilibrium (DSGE) models, and agent-based models (ABMs).
Like current IAMs, DSGE models can explicitly account for uncertainty about the future through the introduction of shocks, for instance, to economic output, consumption or climate damages9. ABMs, by contrast, seek to provide more-realistic representations of socio-economics by simulating the economy through the interactions of a large number of different agents, on the basis of specific rules. ABMs are widely used in finance, but have yet to be seriously applied to climate change. These are promising developments.
Now, a concerted effort is required by the research community to explore as many potential avenues as possible to better estimate the costs of action and inaction on climate change. The IPCC should distil what policymakers need to inform their decision-making. Learned societies and national academies must bring together researchers from a wide range of relevant disciplines to focus attention on improving economic modelling quickly.
Bangladeshi farmers and Cairo city-dwellers are at severe risk of flooding and storms; southern Europe and parts of Africa and the Americas are threatened by desertification. Perhaps hundreds of millions of people may need to migrate as a result, posing an immense risk of conflict.
There is huge potential in future technologies that can drive change. These are omitted or badly underestimated in our current climate modelling — deeply damaging our guidance for policymaking. The well-being and prosperity of future generations are worth more.
Nature 530, 407–409 (25 February 2016) doi:10.1038/530407a
If it cost more to pollute, Americans would pollute less.”
From a Washington Post editorial, Take Mr. Obama’s Oil Fee Proposal Seriously, Feb. 7.
Answering Krugman: Renewables Alone Won’t Stop Climate Disaster
“Climate change just keeps getting scarier,” Paul Krugman rightly pointed out in his biweekly New York Times column yesterday. But fear not, he instructs. A “renewable-energy revolution” is brewing in America — one that won’t require threading a carbon tax through the climate-denying GOP Congressional majority.
This “remarkable technological progress in renewable energy,” which Krugman partly credits to Obama administration stimulus and tax breaks that helped wind and solar scale up and drive down costs, has “put the cost of renewable energy into a range where it’s competitive with fossil fuels.” The U.S. will soon be “leading the world” down the low-carbon path, promises Krugman, so long as the presidency, and Obama’s Clean Power Plan, stay out of Republican clutches.
Leaving aside the fact that the global renewables revolution already has a leader (hint: it’s Europe’s largest economy), there are many reasons to question Krugman’s implicit suggestion that the U.S. and the world can banish carbon fuels fast enough to avert catastrophic climate change without a serious carbon tax in the policy mix. Here are a few:
Demand matters (not just supply) — A renewables-only revolution leaves intact the demand side of the carbon equation. Yet human appetites for energy have proven so boundless that, absent robust prices on carbon emissions, energy demand will invariably outrun the output of even optimized solar and wind power systems — at least during the 50-year time horizon in which our climate fate will be decided.
There’s a new climate villain: cheap oil — With gasoline again going for two bucks a gallon, driving is up and fuel economy is down. Even the Obama administration’s vaunted CAFE standards can’t hold back such powerful price signals. Last year’s bump in U.S. cars’ and trucks’ emissions — the CO2 equivalent of nine good-size coal-fired power plants — will be just the beginning, unless we raise fuel taxes.
Scaling up wind and solar isn’t child’s play — To underscore the first point, take a look at the 100%-renewables plan drawn up for New York State (where both Krugman and I happen to live) by a crack team of physicists and engineers from Stanford. Their zero-carbon and zero-nuclear plan requires 17,000 giant offshore and land-based wind turbines to power just half of the state’s transportation, heating, industry and electricity. (The other half of the energy would come from masses of rooftop solar cells, solar PV and thermal plants, plus existing hydro dams.) Cutting that very tall order down to manageable size cries out for a carbon tax.
Tax breaks cost money — Fiscal-scolding isn’t our thing, but someone must pay for Krugman’s touted solar investment tax credits and wind production tax credits — not to mention ethanol mandates. Moreover, energy subsidies are notoriously hard to dislodge (notwithstanding Sen. Ted Cruz’s victory in yesterday’s Iowa Republican caucuses despite his attacks on ethanol subsidies). And it isn’t necessarily the wealthy who foot the bill, as we showed two years ago in our paper comparing carbon taxes with clean-energy subsidies.
We get that Krugman, an implacable foe of Republican know-nothingism since at least the 2000 elections, thinks it’s essential to keep a Democrat in the White House this November. We also appreciate his “tipping point” argument that “Once renewable energy becomes an obvious success and, yes, a powerful interest group, anti-environmentalism will start to lose its political grip.” And we don’t necessarily insist that every climate commentary begin and end with carbon taxes.
But Krugman, a Nobel laureate in economics, surely knows that in the race to eliminate fossil fuels, raising their prices will go much further than making renewables cheap. We hope his columns will again make this clear, soon.
Cheap Oil’s Peril and Promise in the Fight against Climate Change
Clifford Krauss and Diane Cardwell have a front-page story in today’s New York Times about the challenge that cheap oil poses to the Paris climate agreement. The way that governments respond could make or break the agreement, they say, with huge ramifications for the global fight to stop climate change:
For the climate accord to work, governments must resist the lure of cheap fossil fuels in favor of policies that encourage and, in many cases, require the use of zero-carbon energy sources. But those policies can be expensive and politically unpopular, especially as traditional fuels become ever more affordable.
“This will be a litmus test for the governments — whether or not they are serious about what they have done in Paris,” said Fatih Birol, executive director of the International Energy Agency.
The Carbon Tax Center has repeatedly highlighted this challenge over the past twelve months, particularly in economic terms. Cheap oil has meant cheap gas, which has encouraged more driving and a reversion to gas guzzlers. We calculated last month that increased gasoline consumption in the U.S. alone in 2015 produced carbon emissions equivalent to a year’s worth of emissions from nine coal-fired power plants. That’s equivalent to the entire annual emissions from burning all fossil fuels for all purposes in Denmark or Ireland.
We concluded that cheap oil risks making a “mockery of just about every scenario to move the U.S. and other countries decisively off carbon fuels.” But that’s not the end of the story. Cheap oil paradoxically presents an historic opportunity to pivot away from oil — and all fossil fuels — for good.
As we wrote last January, cheap oil brings a host of positives, like more jobs in most economic sectors, and negatives, like increased fuel use. The trick is how to safeguard the positives while neutralizing the downside. From a policy perspective, this actually isn’t hard to do, and oil’s low price makes it that much easier (as well as more imperative). The real question is whether we have the political will to do so.
The policy solution is a revenue-neutral carbon tax, beginning with a refundable tax on oil. The government would collect the tax at ports and wellheads and distribute the revenues equally to households each month, just like in Alaska. Because tax dollars stay in circulation, the amount of money families have to spend doesn’t fall and the economy benefits. Most families of limited means will come out ahead because on average they spend fewer dollars on oil than they will receive in their monthly revenue check.
By simulating higher fuel prices, we can preserve incentives to get more fuel-efficient. As a result, motorists will buy higher-mileage cars and drive them somewhat less, manufacturers will build more-efficient vehicles and aircraft, and cities and counties will be less inclined to dial back public transit. The same goes for freight movement — goods produced nearby will be advantaged, boosting local agriculture and domestic jobs. You can read more about our proposed oil tax here.
As we and others, including former Treasury Secretary Lawrence Summers, have argued over the past year, the current cheap oil environment is ideally suited for the implementation of a carbon tax. The question remains: do we seize the moment to lock in the good while neutralizing the bad? Or do we instead continue fighting climate change with one arm tied behind our backs?
Is there any evidence for a pause in the long-term global warming rate? The answer is no. That was true before last year, but it’s much more obvious now.”
Gavin A. Schmidt, head of NASA’s climate-science unit (the Goddard Institute for Space Studies), in 2015 Was Hottest Year in Historical Record, Scientists Say, NY Times, Jan. 21.
Just How Scary Is 2015’s Temperature Record? We Count the Ways.
Even for folks hardened by decades in the trenches fighting climate change, the release yesterday of 2015 planetary temperature data was still shocking. The “global land and water temperature” didn’t just set another record last year, it changed the rate at which those records are being set.
This morning we downloaded the official NOAA/NCDC global temperature dataset of temperature anomalies — that’s each year’s deviation from the trend increase averaged across the 20th Century. Here’s what we saw when we ran the stats:
- The 2015 anomaly was 0.90 degrees Celsius (1.6 degrees Fahrenheit; except for graph excerpt at right, all figures here are Celsius); in other words, last year’s global average temperature was almost a full degree above the 20th Century average.
- The 2015 temperature anomaly was 0.16 degrees greater than the anomaly for 2014, making last year’s increase the biggest since 1997 — even though the 2014 anomaly had just set a new record.
- The trendline we drew through 1975-2015 temperature data has a nearly 4 percent steeper slope than our year-earlier trendline for 1975-2014 data. Adding 2015 data in effect lifts the prior trend from its moorings, like an earthquake, tilting it upward.
Here’s how climate scientist Michael Mann characterized the new data, as reported by the New York Times:
Michael E. Mann, a climate scientist at Pennsylvania State University, calculated that if the global climate were not warming, the odds of setting two back-to-back record years would be remote, about one chance in every 1,500 pairs of years. Given the reality that the planet is warming, the odds become far higher, about one chance in 10, according to Dr. Mann’s calculations.
(The entire Times article, which led the paper’s Jan. 21 print edition and was written by the paper’s superb climate reporter, Justin Gillis, is well worth reading.)
Here’s one more way of grasping how the rate of temperature rise is accelerating:
The trendline running through the entire 1880-2015 NOAA/NCDC dataset yields an average rate of temperature rise of 0.0668 degrees per decade; it’s probably easier to multiply that by 10 to derive a per-century rise of two-thirds of one degree. However, a trendline on just the most recent 40 years, 1975-2015, gives an average rise of 0.1664 degrees per decade, or one-and-two-thirds of one degree per century. Over the past 40 years, temperatures have risen 2.5 times as fast as they have over the entire 135-year record.
(NB: Our 1880-2015 slope matches the slope reported by NOAA/NCDC. Our choice of 1975 as the start year for our recent trendline has no particular significance; a regression on 1995-2015 yields a similar slope. For those interested in methodological issues in temperature measuring, the Niskanen Institute posted a useful primer earlier this week.)
In his State of the Union Address last week, President Obama sent a message to senators and representatives on the GOP side of the aisle:
[I]f anybody still wants to dispute the science around climate change, have at it. You will be pretty lonely, because you’ll be debating our military, most of America’s business leaders, the majority of the American people, almost the entire scientific community, and 200 nations around the world who agree it’s a problem and intend to solve it.
It’s hard to discern the extent to which the denialism running through the Republican Party is driven by ideology or by politics, especially since the two are strongly intertwined. At some point, reality will come into play. Temperature data can help that happen. So can election returns.
Putting a solid price on carbon pollution, as Carbon Washington’s I-732 does, would massively accelerate the shift to clean energy.”
Jigar Shah, co-founder and president of Generate Capital and founding CEO of SunEdison, in Duncan Clauson, Endorsement From Jigar Shah, as reported by Carbon Washington, Jan. 5.
British Columbia’s Carbon Tax: By the Numbers
British Columbia, Canada’s third-most populous province, began taxing carbon dioxide and other greenhouse-gas emissions from combustion of fossil fuels nearly seven and a half years ago, pursuant to the province’s Carbon Tax Act. The province-wide tax commenced on July 1, 2008 at a level of $10 (Canadian) per metric ton (“tonne”) of CO2 and increased by $5 per tonne in each of the next four years, reaching its current level, $30/tonne, in July 2012.
The point of the tax is to reduce emissions of carbon dioxide and other greenhouse gases. It is therefore surprising that very little detailed quantitative analysis of the tax’s efficacy in reducing emissions has appeared to date. Answers haven’t been readily available to fundamental questions such as: Have British Columbia emissions of carbon dioxide and other greenhouse gas actually fallen? If they have, by how much? How have the reductions in BC emissions stacked up against the rest of Canada, which does not tax carbon emissions (save for modest taxes in Alberta and Quebec)? How does the recent trajectory of British Columbia emissions compare to that prior to the onset of the tax? Which sectors have shown the biggest, or the smallest, declines?
The Carbon Tax Center searched for answers to these questions during 2015. Not finding definitive data, we set out to develop our own. The result is a new report, British Columbia’s Carbon Tax: By the Numbers, which available here. A spreadsheet with supporting data is available here.
BC’s carbon tax is both the most comprehensive and transparent carbon tax in the Western Hemisphere, if not the world. A recent assessment by two leading environmental economists stated that “British Columbia has given the world perhaps the closest example of an economist’s textbook prescription for the use of a carbon tax to reduce [greenhouse gas] emissions.”
Moreover, the BC tax is gaining adherents. On the eve of the Paris climate summit, in November 2015, Alberta Premier Rachel Notley committed to a similar carbon tax. Alberta’s tax will begin in 2017 at $20 per metric ton and rise in 2018 to $30, matching the current level in British Columbia. Although Canada’s two most populous provinces, Ontario and Quebec, are moving toward carbon cap-and-trade systems, the new Trudeau administration in Ottawa could choose to fashion a national carbon tax from British Columbia’s, with the possibility of higher tax levels to evoke larger emission reductions.
Executive Summary and Key Findings
British Columbia introduced a carbon tax in 2008. Since then, per capita emissions of carbon dioxide and other greenhouse gases covered by the tax have declined, continuing a downward trend that began in 2004. Averaged across the period with the tax (2008 through 2013; no data are available for 2014), province-wide per capita emissions from fossil fuel combustion covered by the tax were nearly 13 percent below the average in the pre-tax period under examination (2000-2007).
The 12.9% decrease in British Columbia’s per capita emissions in 2008-2013 compared to 2000-2007 was three-and-a-half times as pronounced as the 3.7% per capita decline for the rest of Canada. This suggests that the carbon tax caused emissions in the province to be appreciably less than they would have been, without the carbon tax.
To allow comparability, the above figures are per capita. They also exclude emissions from electricity production ― a minor emissions category for British Columbia, which draws most of its electricity from abundant (and zero-carbon) hydro-electricity, but a major emissions source for much of Canada. On a total emissions basis (not per capita), British Columbia emissions of CO2 and other GHGs covered by the carbon tax but excluding the electricity sector averaged 6.1% less in 2008-2013 than in 2000-2007. (The reduction was 6.7% when electricity emissions are counted.) The 6.1% contraction is roughly what would be expected from a small carbon tax such as British Columbia’s. (See sidebar on page 5.)
The carbon tax does not appear to have impeded overall economic activity in British Columbia. Although GDP in British Columbia grew more slowly during 2008-2013, the period with the carbon tax, than in 2000-2007, the same was true for the rest of Canada. From 2008 to 2013, GDP growth in British Columbia slightly outpaced growth in the rest of the country, with a compound annual average of 1.55% per year in British Columbia, vs. 1.48% outside of the province.
GHG emissions increased in British Columbia in 2012 and again in 2013, not just in absolute terms but also per capita. This suggests that the carbon tax needs to resume its annual increments (the last increase was in 2012; its bite has since been eroded by inflation) if emissions are to begin again their downward track.
Click here to read the full report.
- « Previous Page
- 1
- …
- 27
- 28
- 29
- 30
- 31
- …
- 169
- Next Page »