Niskanen Institute president Jerry Taylor, in “Ed Gillespie Is Dead-Wrong About Carbon Taxes,” Nov. 2.
It is just the right moment to introduce carbon taxes.”
Christine Lagarde, Managing Director, International Monetary Fund, quoted in Global Post, Oct. 7.
Pope Francis’s Embrace of Our Environment: Live-Tweeting at the U.N.
The following passages, transmitted by the New York Times via Twitter (@nytimes), capture Pope Francis’s call this morning to world leaders and humanity to place ourselves within, not above, the natural world; to care for Earth rather than destroy it; and to recognize for all living things a “Right of the Environment.”
This is humanity as a geologic force, We’re not a subtle influence on the climate system – we are really hitting it with a hammer.”
Carnegie Institution for Science researcher Ken Caldeira, commenting on a new study he co-authored, reported in Study Predicts Antarctica Ice Melt if All Fossil Fuels Are Burned, by Justin Gillis, NY Times, Sept. 12.
Will Renewables Tip the U.S. into Taxing Carbon?
“Happy solar voters.” That was the picture caption for the smiling solar-powered family that led David Roberts’ post yesterday, “How inefficient climate policies can build support for efficient ones.”
Roberts, who blogged on energy and climate politics for Grist before moving over to Vox this year, counsels carbon-tax advocates to put “Green Industrial Policy” first. That way, solar and wind assemblers and installers and their happy consumers can develop into constituencies strong enough to prevail over the influence and inertia that will otherwise throttle carbon taxes.
Roberts’ post is of a piece with his long-standing disdain for carbon tax campaigners, and he lectures us here as well, insisting we “get over [our] obsession with carbon pricing.” But it also builds on a new article in Science (subscription required) by researchers at U-C Berkeley who surveyed worldwide progress, or lack thereof, in adopting carbon taxes or cap-and-trade permit schemes. “Of the 54 countries and subnational entities that adopted a carbon pricing scheme by 2013,” they report, “nearly two-thirds installed a Feed-in Tariff or Renewable Portfolio Standard before setting up the pricing scheme.”
That’s good to know, if a bit skeletal. The fact that FIT’s or RPS’s preceded the pricing measures doesn’t prove they had to, though they surely helped lay the foundations. Moreover, if advocates and policymakers chose to start with clean-energy subsidies, it might have been because they hoped positive incentives would be enough to move quickly from carbon fuels.
The more pertinent question, though, is whether the U.S. is now at the political take-off point where carbon-pricing can make it into policy. Wind turbines will account for 5 percent of U.S. electricity this year (and more than 15% in seven states last year), and solar-photovoltaic power is growing like gangbusters, thanks largely to Green Industrial Policy galore: state Renewable Portfolio Standards and federal production tax credits (for wind) and accelerated depreciation (for solar). Are the “demonstration” effect and jobs base from renewables strong enough to make the “winning coalition for climate policy” (that’s the Science article title) the U-C Berkeley authors are calling for?
Let’s hope so. Without a robust carbon tax, zillions of electrons in millions of backyard PV arrays are going to be consumed in-house instead of helping the grid back out fossil-fuel electricity. Without a carbon tax, gas-guzzlers and long commutes will keep “extreme” fossil fuels in business, along with their emissions. Granted, a carbon tax isn’t visually arresting like backyard panels. But the innovation and system changes it will catalyze will be at least as instrumental in getting us off carbon.
Photo: Shutterstock, via Vox.
What an Energy-Efficiency Hero Gets Wrong about Carbon Taxes
It’s rare that critiques of carbon taxing are as quantitative as the post last month by David Goldstein on the Natural Resource Defense Council’s Searchlight blog.
Goldstein qualifies as a genuine energy-efficiency hero, in my book. He has spearheaded NRDC’s pioneering analyses of appliance engineering, manufacture and marketing since the 1970s and guided the council’s strategic interventions in utility governance and energy standard-setting in California and at the federal level. This in-the-trenches work has slashed power consumption and carbon emissions from refrigerators, air conditioners, light bulbs and building envelopes in all 50 states. Goldstein’s 2002 MacArthur Foundation “genius award” was richly deserved. (The Washington DC-based American Council for an Energy-Efficient Economy, ACEEE, merits a shout-out as well.)
Befitting his analytical bent, Goldstein’s critique sticks to the high road. No self-fulfilling taunts about carbon taxers’ naivete or the tax’s political infeasibility. His post does drag out a straw man, though, insisting up-front that “carbon emissions fees alone cannot solve the climate problem” — a position held by few carbon tax advocates. (We ourselves “recommend carbon taxes in addition to energy–efficiency standards.”) His criticism sharpens at the end: “In summary, carbon pollution fees, as a stand-alone policy, are incapable of doing much to solve the climate problem.”
Goldstein has certainly thrown down the gauntlet. He has four main arguments, which I’ll treat in order. Some math is involved, but it’s central to the issue.
Argument #1: Carbon Taxes Must Raise U.S. Energy Prices 44-Fold to Meet Our Carbon Targets
Let’s start with an assertion by Goldstein that is startling but accurate — mathematically:
If we wanted energy demand to drop by 85 percent [the minimum required for the U.S. to meet IPCC temperature-rise targets] due to price, the math behind elasticities shows that we would require a price increase of 44 times. This is an impossibility condition. (emphasis added)
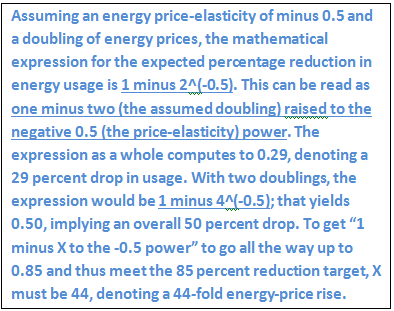
Price-elasticity is how economists denote the extent to which a rise in price causes demand or usage of a good or service to diminish. Assuming, as Goldstein does for argument’s sake (and as we do in modeling carbon taxes), that the price-elasticities of the various forms in which energy is used in the U.S. have an average value of minus 0.5, then a doubling of energy prices, whether effected through a carbon tax or market fluctuations, will cause energy use over time to shrink by 29 percent. (See sidebar for calculations.) With two doublings in price, the shrinkage would be 50 percent.
Note that the second doubling in price produces less of a decrease in usage than the first, reflecting the famed Law of Diminishing Returns. Indeed, three doublings, increasing the price 8-fold, would only bring about an overall 65 percent drop in usage. To hit the 85 percent reduction target requires a 44-fold energy-price rise. Goldstein’s math is spot-on.
But not the use to which it is put. While an 85 percent reduction in energy use would indeed cure the United States’ carbon obligations (not to mention protect and conserve air, water and land), it far exceeds what’s required, thanks to the ongoing and parallel reduction in the carbon intensity of energy supply. This decarbonization of supply is prominent in energy and climate discourse, and has been evident in the electricity sector over the past decade. Measured as pounds of CO2 emitted per kWh generated, the emission rate for all electricity generated in the U.S. last year was 16 percent less than the rate in 2005. For that we can thank increased generation from lower-carbon natural gas and zero-carbon wind. (Solar electric generation, though growing very fast, started from a tiny base and wasn’t a notable factor in the decarbonization to date.) Energy efficiency has helped as well by reducing the need to fire up high-carbon coal plants.
A carbon emissions tax, which by its nature favors wind and solar over gas, and gas over coal, will help sustain and accelerate this encouraging supply-side trend. Indeed, the price-sensitivities built into CTC’s spreadsheet model imply that energy supply decarbonization will account for an estimated 53 percent of the overall projected CO2 reductions from any carbon tax. This means that reductions in emissions via demand, i.e., conservation and/or efficiency, that are Goldstein’s stock-in-trade need only accomplish a bit under half (47 percent) of the total task.
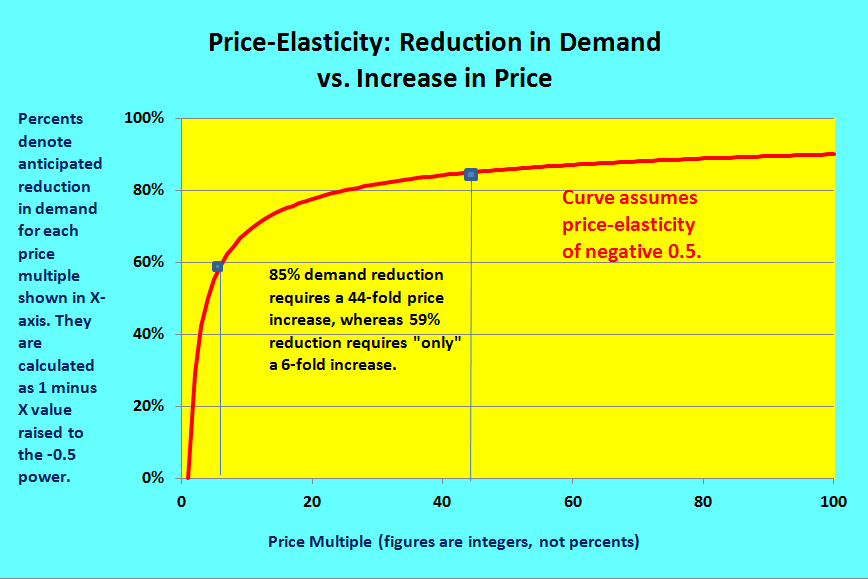 The relevant math, then, is this: Thanks to supply decarbonization, the U.S. can limit its reduction in energy usage to 59 percent and still achieve the 85 percent CO2 reduction target. While a roughly 60 percent reduction in energy consumption is still a tall order, it’s far less fantastical than 85 percent. Assuming energy price-elasticities average minus 0.5, that 60 percent reduction in usage could be effected with a “mere” 6-fold rise in energy prices. No 44-fold rise required. (See calculations at end of this post.)
Argument #2: A Carbon Tax High Enough to Be Effective Would Distort the U.S. Economy
To his credit, Goldstein appears to have anticipated my rebuttal above. He posits a 5-fold increase in energy prices, slightly on the easy side of my 6-fold rise, which he then dismisses on three grounds. Each is problematic, however:
1. “Energy would be pushing a fourth of GDP” (vs. today’s share of ten percent or less), says Goldstein, and, thus, would gobble up too much economic activity. The idea of expensive energy colonizing the economy is definitely a concern in a last-gasp laissez-faire economy in which the costly energy arises through “extreme extraction” of oil from the Arctic, deep waters, and tar sands. But a carbon tax would have the opposite effect, obviating most energy exploration, extraction, conversion, transport and combustion, in accordance with the 60 percent decline in usage posited above. In short, a carbon tax will make our society and economy less energy- and fuel-intensive, not more (while the energy barons, with their wealth clipped, will wield less political power).
2. A 5- or 6-fold increase in energy prices “is not politically possible. Electricity at 50 cents a kilowatt hour?,” Goldstein asks rhetorically. “Gas at $12 a gallon?” Here, Goldstein presumes that a carbon tax would lead to those lofty prices overnight, rather than phasing in over decades. In the latter scenario, the impacts will be softened, yet the price signals guiding long-term investments will be loud and clear. The impacts will be tempered further as the improved efficiency of usage lets businesses and households heat, cool, light and move with fewer units of energy. (Ironically, it was Goldstein and his NRDC colleagues who coined the mantra that what matters is electricity bills and not rates. Note also that CTC is on record criticizing proposed carbon taxes that would start with abrupt energy price rises, on account of the likelihood of economic dislocation.)
3. The carbon tax required to boost energy prices 5- or 6-fold “would be potentially devastating to the poor,” Goldstein argues. Potentially yes, if the wealthy are allowed to siphon off the carbon tax revenues that could buffer U.S. households from the higher energy prices. But the carbon tax designs with the most adherents are those that either use the proceeds to reduce regressive job-killing payroll taxes or distribute them pro rata to households as “fee-and-dividends.” In fact, the need for a socially and economically just distribution of carbon tax revenues only underscores the urgency for environmental progressives to coalesce now behind carbon tax legislation that can safeguard the 90 percent rather than solidifying the advantages held by the top 10 or 1 percent.
Argument #3: Energy Demand is Price-Inelastic, So a Carbon Tax Won’t Affect It
Goldstein next revisits energy price-elasticity in an attempt to show that its actual value lies closer to a barely behavior-influencing (minus) 0.1 than the more robust (minus) 0.5 figure he granted earlier for argument’s sake. But curiously, he builds his case on a commodity that no end-user actually purchases: crude oil. Refineries consume crude, of course, but the businesses and households whose decisions determine aggregate demand consume petroleum products: The fuels whose price-elasticities need to be estimated empirically are gasoline, diesel fuel and jet fuel ― not crude oil.
Over the years there’s been no dearth of claims by representatives of Big Green groups that changes in the price of gasoline elicit little change in usage. Most of these claims are either mere assertions or rest on cursory and selective glances at the data. Perhaps this year’s surge in gasoline sales will finally put that notion to rest: U.S. gasoline sales in the first half of 2015 were 3 percent above 2014 sales — the biggest year-on-year increase in gasoline demand since the late 1970s (subject to the caveat that the comparison covers only six months in each year). The driving force behind this surge isn’t economic activity, since GDP for the first half of 2015 grew only at a middling rate of 2.8 percent; the reason is free-falling pump prices. (NB: The original version of this post had first-half 2015 sales growth at 3.3% over 2014; that figure has been changed to 3.0%, with revised data. The assertion that this is the biggest increase since the late seventies remains valid.)
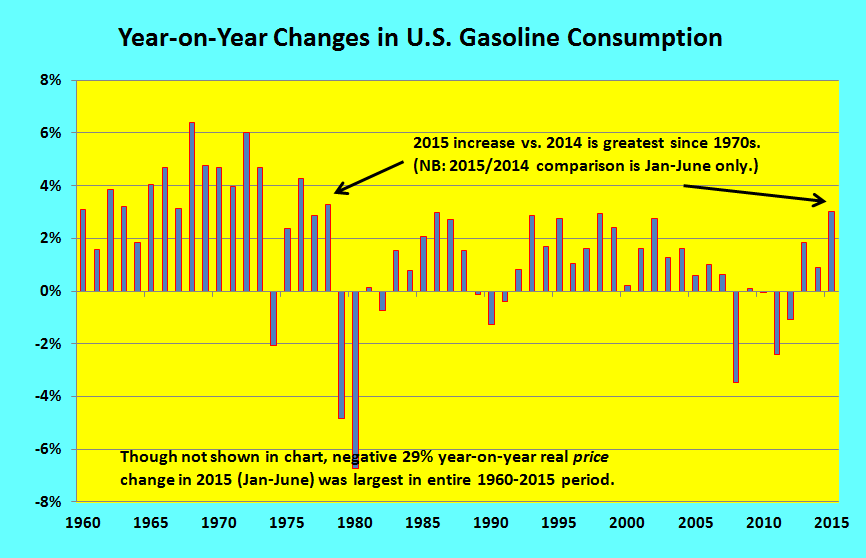 In any event, the way to estimate gasoline’s (or other fuels’) price-elasticity is with multivariate regression analysis. Here’s a summary of the estimation I performed for gasoline for CTC’s carbon-tax spreadsheet:
Using an approach suggested by retired energy economist Vince Taylor, who earned his PhD at M.I.T. from Nobel laureate Robert Solow in the 1960s, and whose insights animated my 1981 magnum opus on nuclear power cost escalation, I “regressed” the annual percentage changes in U.S. gasoline consumption from 1960 through 2014 on three independent variables: (i) the same year’s percentage change in economic activity (GDP); (ii) the same year’s percentage change in the average real retail price of gasoline; and (iii) the average percentage change in that price over the 10 years prior to the current year. The third variable was intended to reflect lags inherent in Americans’ responses to changing gasoline prices, insofar as automobile purchases and location choices that affect usage tend to change over years rather than weeks or months. The parameters may be referred to as income-elasticity, immediate price-elasticity, and lagged price-elasticity, respectively.
Two “models” best fitted the data, both statistically and conceptually. (All variables were statistically significant.)
- One model yielded an income-elasticity of 0.47; an immediate price-elasticity of (minus) 0.12; and a lagged price-elasticity of (minus) 0.21. The sum of the immediate and lagged price-elasticities was (minus) 0.34.
- The other model added a “dummy” variable to adjust for an arguably atypical six-year period covering 2002-2007. This variable was premised on the unusually high discounts/rebates offered for SUV’s during that period, as well as America’s post-9/11 paranoia and Iraq War-inspired triumphalism that may have contributed further to higher purchases and use of SUV’s. (SUV’s average more gas per mile than sedans, of course.) The regression results were, respectively: +0.46, -0.13, -0.24, and +1.4%, indicating an income-elasticity of 0.46; an immediate price-elasticity of (minus) 0.13; and a lagged price-elasticity of (minus) 0.24. The sum of the immediate and lagged price-elasticities was (minus) 0.37. (We ignored the dummy variable as transitory; its inclusion in the model was to filter out influences that could distort the elasticity estimates. May 2016 addendum: we repeated both regressions with 2015 data added. The only change was a slightly reduced income-elasticity in the three-variable model in the prior bullet, to 0.46, from 0.47.)
- From the two sets of regressions, we rough-averaged the respective price-elasticity sums of (minus) 0.34 and (minus) 0.37. The result, a figure of (minus) 0.35, is the price-elasticity we use in our spreadsheet model to estimate the long-term responsiveness of gasoline demand to a carbon tax.
In the CTC carbon-tax model we specify higher price-elasticities for other energy-use sectors: (minus) 0.5 for diesel fuel, (minus) 0.6 for jet fuel, and (minus) 0.7 for electricity. We premise them on businesses’ greater capacity to respond to higher energy prices than drivers’, and on our gleanings from the extensive literature of price-elasticity.
The takeaway? The price-elasticities of U.S. energy usage, while not necessarily high (all are below one), are not only much greater than what Goldstein suggests; they’re large enough to establish beyond any doubt that taxing carbon emission will indeed reduce energy usage, rather than merely punishing consumers into paying more for the same amount of energy.
Argument #4: The Best Path to Carbon Reductions is Prescriptive Energy Policies
So what is the Goldstein-NRDC solution, if not carbon emissions pricing? Here’s Goldstein’s prescription:
This [pessimistic] analysis does not apply to actually implemented or proposed cap-and-trade plans, such as the one adopted by California pursuant to AB32 or the one proposed in the Waxman-Markey bill, both of which rely primarily on non-price energy policies. The overwhelming bulk of emissions savings come from (1) improved building and equipment efficiency standards, (2) integrated land use and transportation system planning that meets goals for travel reduction, (3) emissions standards on fuels and vehicles, (4) requirements for utilities to purchase and integrate renewable energy sources, (5) regulatory reforms that encourage utilities to rely primarily on energy efficiency, and (6) a host of other policies that are independent of energy prices. Numerals added; otherwise quoted verbatim.
That’s NRDC’s credo in a nutshell, and much of it is admirable — particularly #1, which I touted at the start of this post; also #4, which helped jump-start the U.S. wind-power industry (though perhaps no more than did the federal Production Tax Credit for wind electricity), and #5, an effort in which I participated peripherally as a utility reform advocate at the dawn of the “demand-side management” era several decades ago.
On the other hand, it can be argued that the vaunted CAFE standards (#3) were only able to be legislated in the mid-1970s and ramped up several times since then because of rising gasoline prices — somewhat mooting the standards and demonstrating the power of prices that Goldstein largely discounts. Moreover, Goldstein’s #2 is stunningly squishy (“planning that meets goals for travel reduction”); yes, Goldstein had to shoehorn his description but the fact is that NRDC’s standards-and-regulations approach, which has proven so potent in making appliances more efficient, is powerless to rein in the use of vehicles.
The Crux
And therein lies the fundamental difference between Goldstein’s (NRDC) and my (CTC) respective approaches. Miles-per-gallon rules reduce carbon emissions per vehicle-mile driven, but they do nothing to affect the other half of the formula that equally determines emissions: the number of vehicle-miles driven.
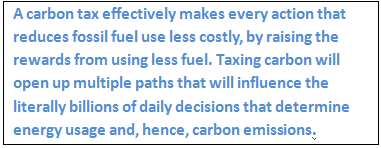
In contrast, a carbon tax effectively makes every action that reduces fossil fuel use less costly, by raising the rewards from using less fuel. Taxing carbon will open up multiple paths that will influence the literally billions of daily decisions that determine energy usage and, hence, carbon emissions.
In driving, a carbon tax will affect whether and how far and often to drive . . . which car to take on a family trip . . . how high an mpg rating to demand in the next lease or purchase . . . and, at the societal level, whether public transit investments “pencil out” and might be prioritized over wider highways, and whether hyper-efficient car designs pencil out in corporate boardrooms and venture-capital spreadsheets.
The same goes for other energy-use sectors. Costlier diesel fuel will not only stiffen legislators’ and regulators’ spines in promulgating truck mpg standards; they’ll incentivize local and regional provision over far-flung shipping of food, raw materials and consumer goods, thus cutting down on freight-miles and resultant emissions. Rising electric rates — at least during the decades until carbon fuels are eliminated — will not only strengthen NRDC’s and ACEEE’s case for ever more-efficient appliances; their price pressures will help restrain the size and number of appliances sold and also motivate consumers to use them more efficiently.
Costlier electricity and natural gas will likewise discourage developers from building, and families from insisting upon, gargantuan homes whose outsize volumes must be heated and cooled. Not to mention that a carbon tax provides an antidote to the oft-postulated “rebound effect” by which increased energy efficiency, by reducing the implicit price of energy services, can engender greater energy usage and inadvertently cancel some of the intended savings from those efficiencies. A carbon tax acts as a direct brake on that implicit price reduction and, thus, on the rebound effect.
The point is clear: No other policy can match a carbon tax’s reach, or its simplicity. As we wrote last year in comments we submitted to the Senate Finance Committee concerning energy subsidies and pricing:
The U.S. energy system is so diverse, our economic system so decentralized, and our species so varied and innovating that no subsidies regime, no matter how enlightened, and no system of rules and regulations, no matter how well-intentioned, can elicit the billions of carbon-reducing decisions and behaviors that a swift full-scale transition from carbon fuels requires. At the same time, nearly all of those decisions and behaviors share a common, crucial element: they are affected, and even shaped, by the relative prices of available or emerging energy sources, systems and choices. Yet those decisions cannot bend fully toward decarbonizing our economic system until the underlying prices reflect more of the climate damage that carbon fuels impose on our environment and society.
Carbon Taxing Going Forward
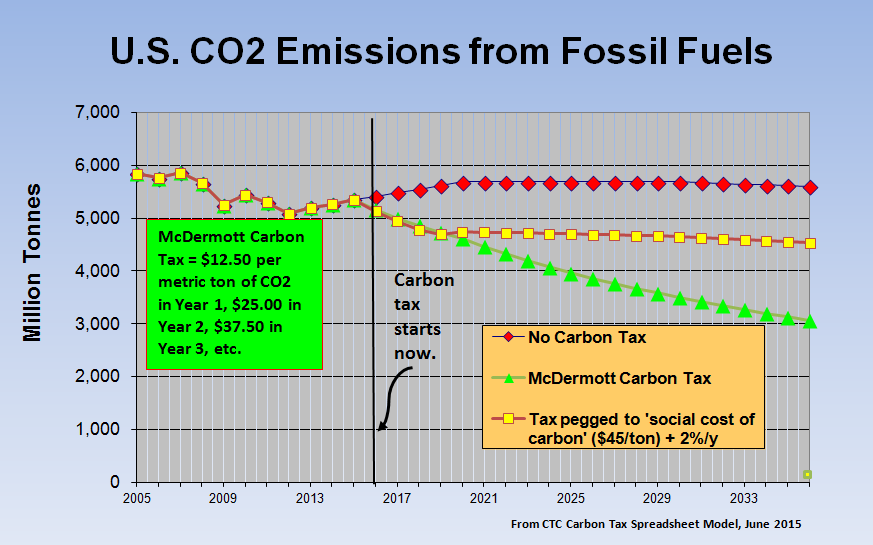
Two carbon tax bills now before Congress — submitted by Reps. Jim McDermott (D-WA) and John Larson (D-CT) — ramp up the tax level steadily and predictably to reach triple digits (i.e., $100 per ton of CO2) a decade on. Our modeling suggests that either bill, by the end of its tenth year, will have reduced total U.S. carbon emissions from fossil fuel burning by more than 30 percent, vis-à-vis 2005 emissions — with the reductions rising as the tax level continues ramping up. As noted, a little more than half of the reductions will come about by sustaining and accelerating the ongoing decarbonization of the U.S. fuel mix, not just in electricity but by motivating increased electrification of sectors like driving that are now dominated by hydrocarbon fuels. The remainder will result from energy efficiency and conservation, i.e., reduced usage per unit of economic activity.
Such a carbon tax has myriad other advantages, including the ease with which it can be replicated globally, that no other approach can match. One unsung advantage is that taxing carbon harmonizes with other measures for reducing energy consumption and carbon emissions. My or other individuals’ energy-savings don’t undermine the tax’s effect on other economic actors ― whereas under cap-and-trade, autonomous energy-saving actions lower the price of the emission permits and thus attenuate the price signal. Likewise, a carbon tax reinforces the economic effectiveness of the appliance and vehicle and building efficiency standards so ably championed by David Goldstein and NRDC, just as those standards play an essential role in overcoming the market failures that are hard to counteract with price signals alone.
It’s 26 years and counting since my first carbon tax op-ed, and almost 9 years since I co-founded the Carbon Tax Center. We at CTC have long since abandoned the hope that NRDC or the other big green giant, the Environmental Defense Fund, would lead the charge for a U.S. carbon tax. We’re okay with that, but we ask our environmental colleagues to refrain from devising and attacking straw-man versions of carbon taxes.
We’ve never said that “carbon emissions fees alone can . . . solve the climate problem.” Rather, we believe that the climate problem can’t be solved without them.
Calculations for 9th paragraph in post: If decarbonization of supply is to account for 53% of the CO2 reduction, and reduction in usage for the other 47%, then K, the percentage change in usage needed to reduce CO2 by 85%, is calculated by the equation: K x K x .47/.53 = 0.15. That is solved by K = 0.41, which equates to a 59% reduction in usage. To effect such a reduction, assuming price-elasticity of -0.5, the factor increase in energy prices, M, is given by the equation: M^(-0.5) = 0.41. The solution is M = 5.95, denoting a 6-fold price rise.
Transformational It’s Not: Running the Numbers on Obama’s Latest Climate Regs
Notwithstanding the hype in the New York Times — “the strongest action ever taken in the United States to combat climate change,” “an aggressive plan to sharply limit greenhouse gases” — the final version of the US EPA “Clean Power Plan” being released today at the White House by President Obama actually constitutes a marked slowdown in reductions in electricity-sector emissions.
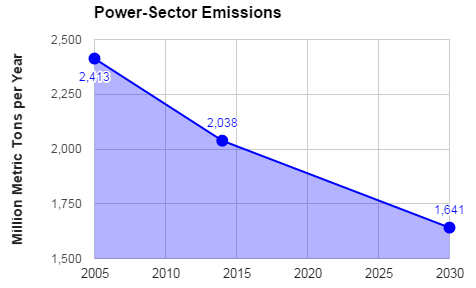
According to published reports, the administration plan calls for a 32% reduction in U.S. power-sector CO2 emissions in 2030, relative to actual 2005 power-sector emissions. That’s slightly more ambitious than the 30% reduction envisioned in the initial Clean Power Plan released in June 2014. Since 2005 power-sector emissions were 2,413 million metric tons (MMT), the targeted 32% reduction would be 772 MMT, or 7% of total projected U.S. emissions (from all sectors) of 5,684 MMT (projected by CTC in the absence of a U.S. carbon pollution price).
Nearly half of that reduction has already been achieved, however. Actual 2014 U.S. power-sector emissions were 2,038 MMT, or 375 MMT less than the 2005 baseline level of 2,413 MMT. Expressed on an annual average basis, power-sector emissions of CO2 fell during 2005-2014 by 42 million metric tons a year.
To fulfill the total 772 MMT 2005-2030 reduction target, the “remaining” 2014-2030 reduction in power-sector emissions need only be 397 MMT. The implied annual rate of reduction over the next 16 years is just 25 million metric tons a year. That’s 40% less than the actual annual 2005-2014 reduction rate in power-sector emissions of 42 MMT per year.
It is probably true that we’re not likely to see a repeat of two factors that contributed to the 2005-2014 reduction in power-sector emissions — the long and deep recession that began in 2007-2008, and the advent of cheap fracked methane that grabbed market share from higher-polluting coal-fired generation. But two other emissions-reducing phenomena remain in full swing: ongoing cost reductions in carbon-free wind and solar photovoltaic power, and the harnessing of both digital tech and new business models to boost energy efficiency in buildings, appliances and businesses.
In this light, it seems premature, if not downright bizarre, to bestow “legacy status” on a plan that targets just one sector (albeit a key one), and that settles for cutting emissions in that sector at a lesser pace than the rate at which they’ve already been falling for a decade.
Here’s What’s New in CTC’s Carbon Tax Spreadsheet Model
We’ve just posted an update to our spreadsheet model — our powerful but easy-to-use tool for predicting future emissions and revenues from possible U.S. carbon taxes. We say taxes, plural, because the model accepts any carbon tax trajectory you feed it and spits out estimated nationwide emission reductions and revenue generation, year by year. Here’s a rundown of what’s new in the update.
1. A year of new data: The most obvious change is the addition of 2014 baseline data on energy use, CO2 emissions and emission intensity for each of the model’s seven sectors.
2. Smoothing the carbon tax impact: A new feature lets users smooth the impact of the tax to reflect real-world lags in households’ and businesses’ adaptation to more-expensive fossil fuels. (You get to set the adaptation “ceiling” rate; any excess gets carried over to future years.) This feature is helpful for trajectories like the Whitehouse-Schatz bill, whose rate starts with a bang at $45 per ton of carbon dioxide but then rises only slowly. Under our default setting, the reductions from the $45/ton initial charge are spread over four years rather than, unrealistically, assigned to the first year.
3. Future baseline is calibrated to official forecast: We tweaked a few model parameters to make our 2040 emissions forecast without a carbon tax match the analogous forecast in the Energy Information Administration’s “Annual Energy Outlook.” This allows for apples-to-apples comparisons with other models that are explicitly calibrated to the EIA/AEO forecast.
Arctic Oil vs. Carbon Tax? It’s Not Even Close.
It is true that the stroke of the presidential pen with which Barack Obama last week granted Shell Oil Corp. permission to drill off Alaska’s Arctic Coast cannot also put into force a U.S. carbon tax, without authorization by Congress. And it is all too possible that when climate reality eventually sweeps over the Capitol, the resulting carbon tax may be modest in scale and take a lot longer than a decade to reach the $100/ton level that would drive massive reductions in fossil fuel use and CO2 emissions.
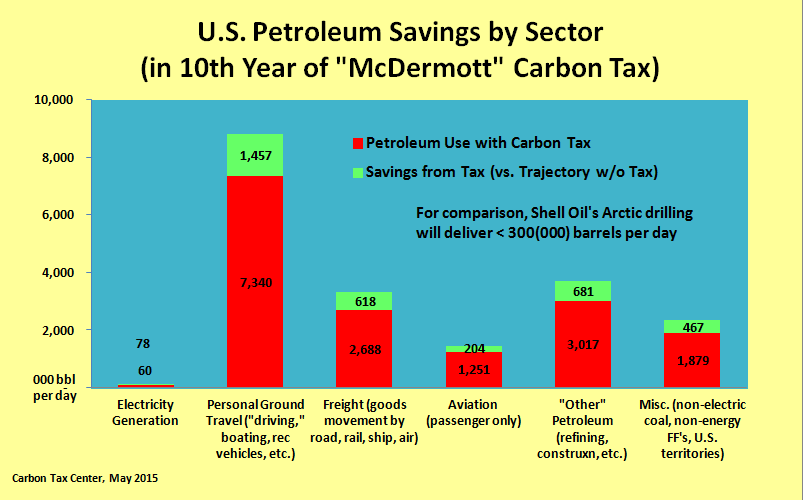
All the same, it’s instructive to compare the capacity of Arctic drilling to supply oil with that of a robust carbon tax to quench the need for it. The outcome — the carbon tax wins — may not surprise. But the lopsidedness is startling: in just its tenth year, the carbon tax proposed last November by Rep. Jim McDermott (D-WA), starting at $12.50 per metric ton of carbon dioxide and rising annually by $12.50 as well, would be eliminating the need for oil at around a dozen times the rate at which Shell would be pulling the stuff from the Arctic.
Here are the numbers:
♦ Royal Dutch Shell’s Chukchi Sea project is projected by the U.S. Bureau of Ocean Energy Management to extract 4.3 billion barrels of crude over a 44-year period. (See Chukchi Sea Oil & Gas Lease Sale 193 Draft Second Supplemental Environmental Impact Statement, Volume 1 [pdf]; go to pp. 6 or 62 or 182 of 694.) This equates to daily production of 268,000 barrels. An estimated 2.2 trillion cubic feet of methane (natural gas) would be extracted as well; on a btu basis that equates to 360 million barrels of oil, or 23,000 barrels a day. Combined extraction of hydrocarbons is then around 290,000 barrels a day. (Note that we have not netted the energy expended to “discover,” extract and transport the oil.)
♦ For the carbon tax, we modeled McDermott’s Managed Carbon Price Act of 2014, setting the annual increases as the midpoint between the bill’s floor and ceiling prices. The price per U.S. (not metric) ton of CO2 in the tenth year, 2024, is $113.40. (Our model, which we’ll update soon, had the tax starting in 2015.) As indicated in the graph, the reductions in petroleum requirements would be substantial in every consuming sector. They sum to 3,486,000 barrels a day — 12 times the 290,000 bpd equivalent anticipated from Shell’s Arctic venture.
The estimated oil savings from the McDermott carbon tax amount to nearly one-fifth of U.S. oil consumption in both 2013 (the last data year in our model) and 2024 projected without a national carbon price. The biggest reduction in absolute terms is in what we call personal ground travel (chiefly driving), which dominates petroleum use. But on a proportional basis the savings would be greater in commercial sectors such as freight movement, oil refining, and construction, as the unmistakable price signal from the annually rising tax drives innovation enabling lower usage.
Still, the projected reduction in gasoline consumption for personal ground travel in 2024, 1.4 to 1.5 million barrels per day, commands attention. [Read more…]
[B]y far the biggest way countries reduce the [market] price of energy is by not taxing it enough to account for the damage that burning fossil fuels causes to human health and to the climate.”
The High Cost of Dirty Fuels, NY Times editorial, May 21, 2015.
- « Previous Page
- 1
- …
- 29
- 30
- 31
- 32
- 33
- …
- 170
- Next Page »

