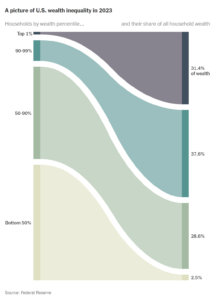
Graph at right is from a New York Times guest essay, “Bidenomics Has a Mortal Enemy, and It Isn’t Trump,” published Nov. 16, 2023, by Karen Petrou, managing partner of Federal Financial Analytics and author of “Engine of Inequality: The Fed and the Future of Wealth in America.” It’s the latest in a series of graphs and charts in books and periodicals portraying the stark dimensions of economic inequality in the United States.
Economic inequality entered widespread discourse in the U.S. in 2011, propelled by “Occupy Wall Street.” Attention has risen meteorically since then while the scope of the issue has broadened.
Initially the discussion centered on income inequality — the stark and widening gap between wages and earnings of the top 1 percent of U.S. households and everyone else. Among the many formulations, this one stood out:
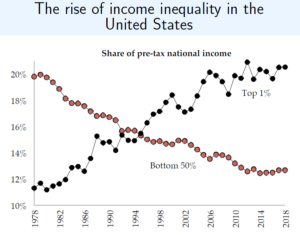
Since 1980, the U.S. economy has transferred eight points of national income from the bottom 50 percent of households to the top 1 percent: the share of income going to the bottom 50 percent fell to 13 percent from 21 percent while the share accruing to the top 1 percent grew from 11 percent to more than 20 percent, according to a Chicago Tribune story summarizing the 2018 World Inequality Report. (See graphic at left.)
Stage two in inequality discourse was wealth inequality — the appropriation by the super-rich of U.S. assets: bank accounts, stock funds, bonds, partnerships and other financial assets, along with real property — houses, land, real estate, art and so forth.
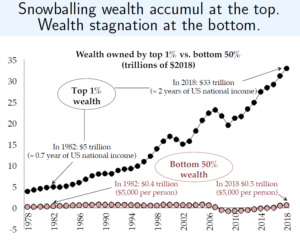
Also from the Saez & Zucman book, whose full title is “The Triumph of Injustice: How the Rich Dodge Taxes and How to Make Them Pay.”
Again using 1980 as a baseline, total wealth held by the top 1 percent of U.S. families has snowballed, as the graphic at right shows, increasing more than 6-fold to 2018, from $5 trillion to $33 trillion. At the same time, holdings of the bottom 50 percent of households inched upward by just $100 billion — from $400 billion to $500 billion. (Figures are in 2018 dollars.) The wealth of the top 1 percent now dwarfs that of the entire bottom 50 percent by a factor of 66. This makes for a per-household disparity of 3,300 (since 66 x 50 = 3,300).
Using 2019 data, Allianz Research reported calculating a U.S. wealth inequality “Gini coefficient” of 0.81. (The Gini Coefficient is a measure of population inequality ranging from zero to one; a completely equal distribution — all households have the same income or, in this case, wealth — gives 0, while a completely unequal distribution — all wealth is held by a single household — gives 1.)
A Gini figure of 0.81 indicates that the United States today is four times closer to having one family own all of its wealth than to having the same wealth equally distributed among all. (See Allianz Global Wealth Report 2020, Sept 2020, p. 25.) The Covid-19 recession has almost certainly sharpened this division, as the New York Times’ Farhad Manjoo pointed out in his Nov. 25, 2020 column, Even in a Pandemic, Billionaires are Winning. Citing calculations by Chuck Collins at the Institute for Policy Studies, Manjoo reported that from March 18, when most of the U.S. economy was entering its Covid lockdown, to Nov. 24, the combined worth of America’s billionaires grew from $2.95 trillion to nearly $4 trillion, an increase of one-third.
The increase was driven by a soaring stock market (itself propelled by the Republican 2018 tax cuts on extreme wealth) and increasing returns to digital monopolists such as Amazon’s Jeff Bezos and Zoom’s Eric Yuan. Meanwhile, the ranks of the unemployed swelled with laid-off workers, many of them facing hunger and homelessness as the Republican-led Senate blocked a re-up of the federal cash grants issued earlier in the pandemic.
The third and current “frontier” in the inequality discussion, and perhaps the most salient one for climate policy, is tax inequality, encompassing the precipitous decline since 1980 in taxes paid by the wealthiest Americans relative to their incomes … and the rise in tax payments by ordinary households relative to their incomes.
The graphic below differs from the prior two in that the wealthy are represented by the 400 richest Americans — a far more rarified stratum than the roughly 1.3 million households that constitute the 1 percent depicted in the other graphs. It also reaches back to 1960 rather than 1980 to demonstrate that the share of pre-tax income that the super-wealthy are paying in taxes has fallen from 57-58 percent in 1960 to 23 percent, while taxes paid by the bottom half of Americans now (in 2018) have risen to 24 percent of their income.
“For the first time,” report U-C Berkeley economics professors Emmanuel Saez and Gabriel Zucman, in 2018 “billionaires paid lower tax rates than the working class,” which is how Saez and Zucman characterize the bottom 50 percent of U.S. households. This is no Warren-Buffet-is-taxed-less-than-his-secretary unicorn but a comprehensive finding based on exhaustive quantification of every type of tax to which Americans are subject: federal income taxes, state income taxes, state sales taxes, payroll taxes, property taxes, estate taxes, and excise taxes on gasoline, alcoholic beverages and imported goods (tariffs).
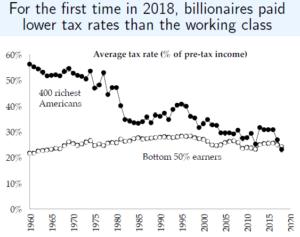
Notably, the Saez-Zucman analysis extends from the early 1900s through 2018, although only recent decades are shown here.
Over the course of 2019, Saez and Zucman helped put tax inequality on the political map by assisting Sen. Elizabeth Warren and, later, Sen. Bernie Sanders in formulating their plans to levy taxes on “extreme wealth.” The Warren plan would have taxed household wealth above $50 million at annual rates of 2 percent (Warren called this her “2 cent” tax), rising to 3 percent on wealth in excess of $100 million. Sanders would similarly have taxed wealth above $32 million — a level enjoyed by the top 0.1 percent (1/10 of 1 percent) of U.S. households — at 2 percent, with the rate rising progressively until reaching 8 percent for household wealth exceeding $1 billion.
It doesn’t take a degree in economics to see why tax inequality has skyrocketed along with wealth inequality for a half-century, and especially since around 2000. The marked reduction in tax rates has allowed wealthy Americans to hold on to increased shares of their income and thus to amass ever-larger piles of wealth.
At the same time, the super-wealthy have invested some of their increased holdings in anti-tax think tanks, media, campaign contributions and lobbying that have steadily chipped away not just at tax rates themselves (on corporate taxes, capital gains taxes and estate taxes) but at the very conception of taxes and government as expressions and agents of the common good. A key development, as Saez and Zucman reported in their 2019 book, The Triumph of Injustice, has been the emergence of a full-fledged tax-avoidance industry dedicated to enabling rich households to reduce the exposure of their income to even the lowered rates specified in the U.S. tax code.
“It is as if a century of fiscal history has been erased,” Saez and Zucman wrote. “The wealthy have seen their taxes rolled back to levels last seen in the 1910s, when the government was only a quarter of the size it is today.” Especially since 1980, they added, “the tax system has enriched the winners in the market economy” — particularly globalization, financialization, communications and digital tech — “and impoverished those who realized few rewards from economic growth.”
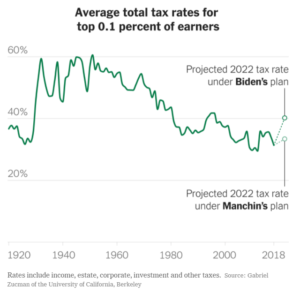 Zucman recently (Oct 2021) produced the chart at right, which New York Times senior Washington correspondent David Leonhardt used in his Oct 7, 2021 column, Taxing the Rich: Americans strongly favor raising taxes on the rich. Why are Democrats struggling to do so?. It shows, first, that the total tax rate (inclusive not only of federal income taxes but state and local, estate, corporate and other taxes) on the top one-tenth of one percent of American households has plunged by nearly one-half, from 60 percent in much of the 1930s, 1940s and 1950s to a little over 30 percent today; second, that President Biden’s proposed suite of tax increases on high earnings and corporations would raise that figure to just 40 percent, recovering less than a third of the lost tax rate.
While these trends are powerful, they aren’t inevitable. “The history of taxation,” Saez and Zucman reported, “is full of U-turns.” We at Carbon Tax Center want to help American society execute a full U-turn toward tax equality. We hope to conceptualize and map a plan to tax extreme wealth and invest the proceeds in a Green New Deal of low- and eventually zero-carbon infrastructure based on 100% renewable power and conversion of all transport, heating and cooling and industry to electricity.
Don’t miss Saez and Zucman’s Web site, TaxJusticeNow, which not only includes the charts presented here (and many others) but allows viewers to input their own tax plans and see outcomes including revenue streams and reductions in the wealth of Bezos, Zuckerman and other prominent billionaires.
See also the New York Times’ Feb. 20, 2020 profile of Saez and Zucman, The Liberal Economists Behind the Wealth Tax Debate.
Note: As much as we admire and rely on the work of Saez and Zucman, they are far from the only sources quantifying and documenting U.S. economic inequality. The invaluable Center on Budget and Policy Priorities publishes and updates a useful Guide to Statistics on Historical Trends in Income Inequality. The Web site Income Inequality cuts a very wide swath that we are just beginning to explore. See also a post in Vox by Dylan Matthews in August 2019, You’re not imagining it: the rich really are hoarding economic growth, that considered various “technical” objections to the Saez and Zucman work (e.g., deflating income growth by the Consumer Price Index unfairly flattened lower-income families’ real income gains) and Saez-Zucman’s counterarguments.
A New York Times primer on the Race Wealth Gap
The following passages are excerpted from Beyond Pandemic’s Upheaval, a Racial Wealth Gap Endures, by Patricia Cohen, April 12, 2021. For space reasons we have excised portions of that story dealing with policies to reduce the gap.
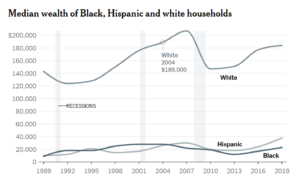
Wealth — one’s total assets — is the most meaningful measure of financial strength. Yet for every dollar a typical white household has, a Black one has 12 cents, a divide that has grown over the last half-century. Latinos have 21 cents for every dollar in white wealth.
Such disparities drag down the American economy as a whole. A study by McKinsey & Company found that consumption and investment lost because of that gap cost the U.S. economy $1 trillion to $1.5 trillion over 10 years, or 4 to 6 percent of the projected gross domestic product in 2028.
Government support is crucial, economists say, because there is so little that individuals can do on their own to close the wealth gap. The most surprising finding that researchers at the Federal Reserve Bank of St. Louis established after a decade-long study of inequality and financial vulnerability was that no matter what financial decisions you make or schools you attend, roughly 80 percent of those yawning disparities are determined by your skin color, the year you were born and your gender.
The heavy hand of a history studded by intimidation and terrifying violence, segregation and unfair housing, zoning and lending policies has prevented generations of Black families from gathering assets.
In the 19th century, when the government distributed the country’s most realizable asset — land — during the Homestead Act, African-Americans were left out. In the 20th century, when the focus shifted to building a berth in the middle class through homeownership, African-Americans were again largely excluded from federal mortgage loan support programs and the G.I. Bill of Rights. Tax policies, in turn, favored the wealth-building strategies that were offered to whites.
Even New Deal assistance programs like unemployment insurance that were created to help people survive the Depression excluded agricultural and domestic workers, who were overwhelmingly Black.
Again and again, African-Americans were shut off from the capital that makes capitalism work.
Unequal outcomes in one generation turn into unequal opportunities in the next. Without assets, Black parents cannot offer as much financial support to help pay for their children’s education, first home or efforts to start a small business.
Americans, much more than people from other countries, interpret “their advantages in terms of things they themselves have earned or deserved as opposed to thinking it’s the result of an unfair world,” said Paul Piff, a psychologist at the University of California, Irvine. “Then the inequalities you’re seeing aren’t unfair, they’re just necessary outcomes of things that people did or didn’t do,” he said, so you are less willing to do anything about them.
Ray Boshara, a researcher at the St. Louis Fed, said the implications were particularly pertinent in thinking about the racial wealth gap. “People feel they’ve earned everything they have, but the evidence just doesn’t support that. It counters the American narrative that everybody who has something made it on their own.”
Challenging shibboleths about hard work and personal responsibility can meet resistance. People often take immediate offense, interpreting the argument as detracting from their own demonstrable hard work, skills and talent. What the research highlights, though, are the outside forces that prevent other individuals who are just as talented and hardworking from achieving the same success.
The same house in a Black neighborhood will fetch less money than it would in a white one. A Black worker with the same credentials as a white colleague will earn less. Even among college graduates, the Black jobless rate tends to be twice as high as the rate for whites. Such inequities operate like an invisible tax on African-Americans, a tax on being Black.

