Estimated CO2 Reductions from a Briskly Rising Carbon Tax
The Carbon Tax Center long considered Rep. James McDermott’s “Managed Carbon Price Act,” one of the two most effective climate measures ever introduced in Congress. (The other, the “America’s Energy Security Trust Fund Act” introduced in 2009 and re-introduced in 2015 by Rep. John B. Larson, chair of the House Democratic Caucus and fourth-ranking Democrat in the House of Representatives, had a similar price and ramp-up and therefore a similar emissions reduction profile.) The bill by McDermott, a staunch Democrat who represented Washington’s 7th congressional district from 1989 to 2017, would have established a national carbon tax starting at a rate of $12.50 per metric ton of carbon dioxide, rising annually by the same $12.50/metric ton.
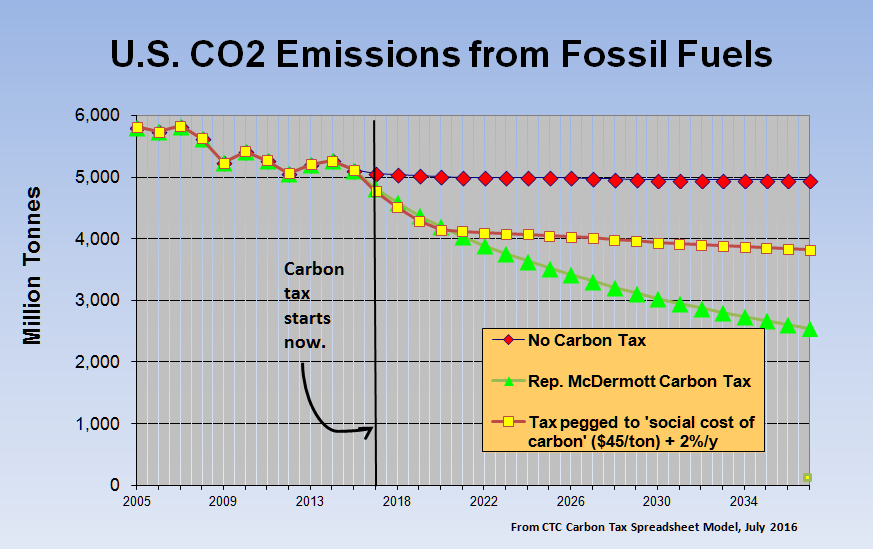
We estimated that the carbon tax levels mandated under the McDermott bill would have reduced U.S. CO2 emissions from fossil fuel combustion by 1/3 within a decade. Using our 8-sector carbon-tax-model spreadsheet, we projected that the bill would have led to the progression of emission reductions shown in the graph below:

U.S. CO2 emissions from burning fossil fuels would decline by 1/3 in the first decade after enactment of Rep. McDermott’s measure, according to projections by CTC. The middle curve, included for comparison, shows emissions if the carbon tax is set at the “social cost of carbon.”
Discussion
Carbon taxes embody the principle that truthful prices for fossil fuels must include the “externality costs” that their burning imposes on society, i.e., that polluters should pay for the damage caused by polluting. Briskly increasing carbon taxes will instill in energy consumers and producers strong incentives to efficiently reduce their use of fossil fuels and the attendant emissions of carbon dioxide while increasing efficiency and shifting to renewable energy.
The “supply-side response” will materialize largely through investment — for example, in carbon-free wind or solar power farms or lower-carbon gas-fired generating plants, or possibly in low-carbon biofuels. The “demand-side” response will arise in literally millions of decisions, ranging from the choice of car to drive (in multi-car households) to longer-term location decisions of families, businesses and institutions, all reflecting the fact that usage is at least somewhat sensitive to price, i.e., there is some “price-elasticity” (to use economic jargon) in energy usage.
To capture these responses quantitatively, CTC has developed an 8-sector National Carbon Tax Model, which we update every year or two. The model captures both demand- and supply-side responses to carbon taxes and incorporates time lags in end-users’ responses to the tax-induced higher prices. It divides U.S. CO2 emissions into seven sectors: electricity, which in 2015 accounted for 37% of nationwide CO2 emissions; personal ground travel, accounting for 22% (almost entirely from burning gasoline); freight (goods movement), 9%, largely diesel fuel for trucks; jet fuel for air travel (4%), oil refining (6%), other petroleum (also 6%), natural gas other than for electricity (11%), and, an eighth “sector,” miscellany (5%).
We apply separate long-run demand price-elasticities — 70% for electricity, 35% for gasoline, 60% for jet fuel, and 40-50% for the other sectors — with further assumptions for supply-side substitution of carbon as well. (All assumptions are detailed in the spreadsheet; users may input their own. Readers interested in the carbon contents of electricity and various fuels may also wish to examine our Carbon Contents spreadsheet.)
As configured in the file version, the model assumes an initial (year-2016) carbon tax of $12.50 per metric ton of carbon dioxide, ramped up each year by the same $12.50 per metric ton (so that the tax level in the tenth year is $125 per metric ton of CO2, which equates to $113.40 per short ton, for example). The model indicates that such a carbon tax would, by 2026, result in U.S. CO2 emissions falling 31-32% below today’s baseline projections for 2026, and 41% below actual CO2 emissions in 2005. Also strikingly, the carbon tax provided in the McDermott bill would cause U.S. petroleum consumption in 2026 to be 26% less than 2005 actual consumption and 19% below 2026 projected consumption (without a carbon tax).
Notes on Price Elasticity
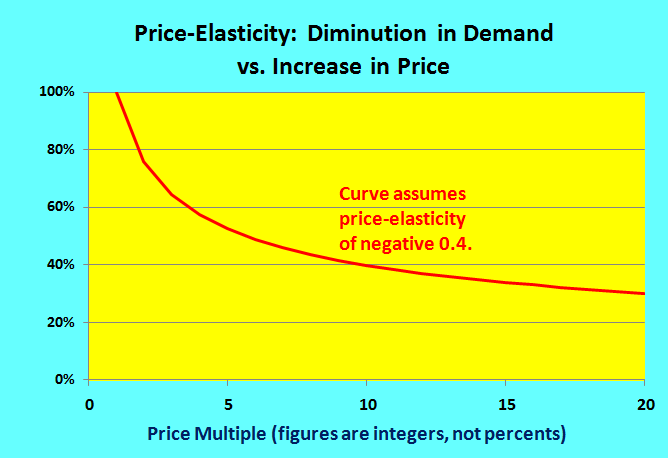
 Demand price-elasticity denotes the extent to which rises in price engender a drop in demand. A price-elasticity of 50% means that the drop in demand is half as steep as the price rise. Thus, a 2% increase in price would be required to engender a 1% decrease in demand. Importantly, for large price increases such as we propose over time, the drops in demand would be proportionately less, reflecting the law of diminishing returns. And at the same time the phased-in tax is causing prices of fossil fuels to rise, incomes would be rising, offsetting some of the reductions.
Because many if not most determinants of energy use such as infrastructure, location and capital goods like houses and cars can’t be changed overnight, drops in demand due to higher prices can take years to materialize fully. Our elasticity estimates are “long-run” figures, requiring around a decade to manifest fully, as opposed to “short-run” elasticities that apply to rapid but smaller changes, i.e., within a year. Short-run elasticities also exist, of course, as everybody who hesitates before paying an increased price for a product is aware, but they are less than the long-run values.
In a 2015 blog post, What an Energy-Efficiency Hero Gets Wrong about Carbon Taxes, we explored (and dispelled) some myths about price-elasticity and carbon taxes that are surprisingly widespread, even among veteran environmental advocates and analysts. It remains one of our most widely read posts, and we commend it to anyone seeking to understand how, why and how fast a carbon tax can be expected to cut carbon emissions.
Below we give links to articles and papers on energy price-elasticity in the United States. Some are for a general audience, some are technical. Many focus on automobiles and gasoline, the area of energy use that has been studied the most.
- Resources for the Future working paper 23-11, Prest, Fell, Gordon & Conway, Estimating the Emissions Reductions from Supply-side Fossil Fuel Interventions, 2023. Belying the title’s supply-side emphasis, this paper contains an excellent compendium of recent research estimating demand elasticities in the U.S. and some other countries for gasoline and/or crude oil. It finds an average of (negative) 0.35 for crude oil’s elasticity. Though the authors’ assertion that gasoline’s demand elasticity should be double that for crude oil would imply 0.70 for gasoline, we believe that this assertion is somewhat simplistic, especially for the United States, where infrastructure, culture and policy inhibit demand adaptation. All things considered, we believe the paper’s conclusion supports a U.S. gasoline demand price-elasticity greater than 0.35 but not twice as great.
- J.E. Hughes, C.R. Knittel, D. Sperling, Evidence of a Shift in the Short-Run Price Elasticity of Gasoline Demand, 2006, National Bureau of Economic Research. The authors sifted 2001-2006 gasoline use data and found price-elasticity to be minuscule — just 4% in the short-run and, though they didn’t quantify it, not much greater in the long-run.
- Kenneth Small & Kurt Van Dender, Fuel Efficiency and Motor Vehicle Travel: The Declining Rebound Effect, 2006, revised 2007 (a shorter version was published in Energy Journal in 2007). Small, a Professor of Economics at U-C Irvine and a peerless transportation economist and thinker, co-authored the most perceptive and persuasive analysis of U.S. gasoline demand we’ve seen. The paper analyzed 1966-2001 data for each of the 50 states and found (i) a short-run price elasticity of gasoline of roughly 9% (comprised equally of changes in fuel efficiency and miles driven); and (ii) a long-run price elasticity of gasoline of around 40% (also arising equally from changes in fuel efficiency and miles driven). Note: Prof. Small told us that adding more recent data through 2004 doesn’t alter these findings.
- J.E. Hughes, C.R. Knittel, D. Sperling, Evidence of a Shift in the Short-Run Price Elasticity of Gasoline Demand, 2006, National Bureau of Economic Research. The authors sifted 2001-2006 gasoline use data and found price-elasticity to be minuscule — just 4% in the short-run and, though they didn’t quantify it, not much greater in the long-run.
- C. Komanoff, Komanoff letter to Sperling. In a letter sent in December 2006, CTC’s Komanoff asked Prof. Sperling to reconcile his findings above with the contrary findings of Small & Van Dender.
- Nicholas Lutsey & Daniel Sperling, Energy Efficiency, Fuel Economy, and Policy Implications, Transportation Research Record, 2005. Though not strictly about price elasticity, this paper deconstructed technical changes in the U.S. auto fleet from 1975 to the early 1980s, a period in which most technical gains were devoted to improving fuel efficiency, and since then, when technical improvements were used “to satisfy private desires (more power, size and amenities).” Anyone seeking to understand automobile fuel economy should read this paper.
- Dermot Gately & Hillard G. Huntington, The Asymmetric Effects of Changes in Price and Income on Energy and Oil Demand, 2001, Economic Research Reports, RR# 2001-01, C.V. Starr Center for Applied Economics, NYU. Using 1971-1997 data, and lumping the U.S. with the other (OECD) industrial nations, the authors derived long-run price-elasticities of only 24% for all energy, but 64% for petroleum products alone. (Could fuel substitution be the reason for the disparity?) Encouragingly, they reported a relatively low long-run income-elasticity, 55-60%, for both oil and energy in the OECD countries, indicating that, all things equal (i.e., with constant prices), each 3% growth of GDP gives rise to less than a 2% rise in energy use.
We invite CTC friends and visitors to comment on these materials and to suggest further reading. In 2007 environmental journalist-activist Gar Lipow compiled a handy bibliography of some of the best studies on the price-elasticity of demand for energy. Gar’s summaries of nearly two dozen price-elasticity studies from the U.S. and around the world are an invaluable guide to this important subject.
We also recommend the overview of seven sets of integrated assessment model results presented in “Carbon Taxes to Achieve Emissions Targets, Insights From EMF-24” (Stanford Energy Modeling Forum, 2012) which concluded that a carbon price would need to rise briskly, to roughly $440/ton CO2 by 2050 to reduce U.S. emissions in that year by 80%. That’s a serious price trajectory, in line with CTC’s modeling results.
