A post last week by a U-C Berkeley Business School professor got me fretting over the staggering rise in China’s fossil fuel use over the past two decades and wondering what it will take to not just rein it in but reverse it.
Just since 2000, Prof. Lucas Davis wrote in Putting China’s Coal Consumption in Context, the amount of electricity China generates from coal, which of course is the most carbon-intensive of the three fossil fuels — went from one-half that of the United States to six times as much, as shown in his graph reproduced here at left. That’s a 12-fold reversal (!), which he parses into China’s nearly five-fold increase at the same time that U.S. coal-fired electricity production was falling more than two-fold.
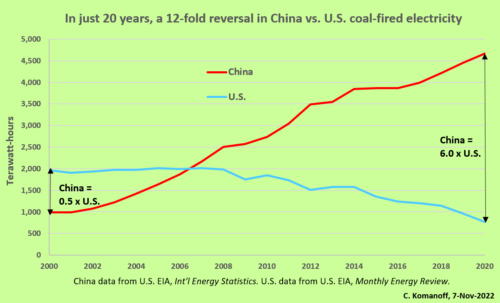
Our remake of Prof. Davis’s graph from his post cited in text.
It was heartening that Davis, an energy and climate specialist at the business school’s Haas Energy Institute, said straight-up that “The biggest single factor explaining the divergent patterns is that China’s demand for electricity is soaring, while U.S. demand is practically flat.” Too many commentators simplistically credit cheap fracked gas for the sharp, sustained drop in U.S. coal-fired power generation, ignoring the flattening in electricity use that allowed gas-fired electricity to substitute for coal rather than simply add to it — a phenomenon we pointed out in 2016 and again in 2020, in our twin “The Good News” reports, which also quantified wind and solar power’s rising contributions.
That said, the subject here is China, whose electricity use has skyrocketed while its mix has stayed nearly locked in place. The surge in solar and wind electricity generation, though considerable, hasn’t kept coal-fired power generation from growing rapidly. China now accounts for more than half of the entire world’s production of coal-fired electricity, according to Prof. Davis. Moreover, as we show below, China’s year-to-year increases in kilowatt-hours made from fossil fuels have exceeded the same year’s combined increases in wind and solar electricity in all but 2 of those 20 years.
(Note, “coal” and “fossil fuels” are used interchangeably in this post, befitting coal’s dominance over the other fossil fuels in making electricity: in 2020 the respective kilowatt-hours percentages were 95.0% coal, 4.8% gas, 0.2% oil.)
Coal’s Unbroken Electricity Dominance
Following Davis’s lead, we charted China’s annual electricity production by fuel type from data compiled by the U.S. Energy Information Administration. To help the graph pop, we consolidated coal, oil and gas into a single fossil fuel supergroup. We also combined wind and solar, and dropped the small “biomass and waste” category.
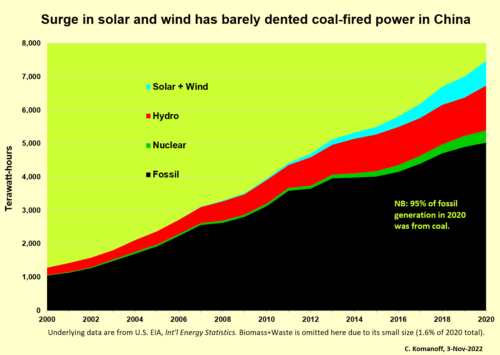
The biggest takeaway is the unrelenting growth in fossil (coal) generation, despite the concurrent expansion of both hydro-electricity (concentrated in the first decade) and wind and solar (more pronounced in the second decade).
Indeed, coal/fossil accounted for 63 percent of the increase in China’s electricity generation over the entire 20-year period. Even in just the past five years, when wind and solar have enjoyed their greatest increases in absolute terms, 50 percent, or half, of China’s increased electricity generation has been via fossil fuels; solar and wind combined accounted for only a quarter, 25 percent.
To make these changes easier to see we created another graph showing year-to-year growth (or contraction) in the same four categories. Note the 2014-2015 period when fossil-fuel production of electricity barely grew, on account of both below-average growth in total electricity generation and above-average rises in hydroelectric and nuclear power output.
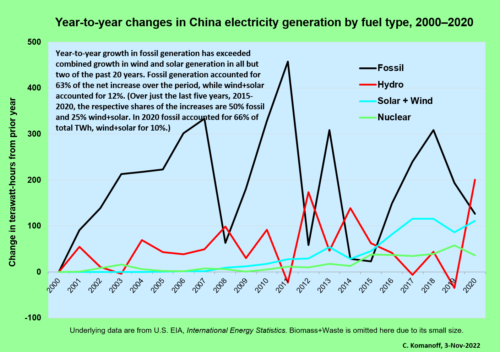 Those two years coincided with a flowering of climate optimism, with the U.S. and China reaching a bilateral agreement to curb emissions — ostensibly dissolving the “alliance of denial” by which both countries used each other’s inaction as a pretext to forego action on climate — and setting the stage for the 2015 Paris climate accord. Beginning in 2016, however, China’s fossil-fuel electricity generation (again, overwhelmingly coal-fired) recovered most of its prior increase pace. Year-to-year growth in fossil output has averaged 200 annual terawatt-hours since then.
When Will China’s Fossil Generation Start to Contract?
At some point, the rises in wind and solar, supplemented by increased nuclear power production, will almost certainly exceed growth in overall electricity demand. That will allow the gargantuan fossil-fuel generation sector to begin to contract, as it has done in the United States since 2007. (Comparing 2021 to 2007, the peak year, U.S. fossil fuel power generation is down more than 16 percent, whereas in China the same metric doubled.)
That kind of turnaround does not appear imminent for China, however, as suggested by the right-hand part of the graph directly above, showing year-to-year changes. Annual rises in fossil electricity production continue to exceed annual rises in wind and solar. (The relative dip in fossil-electricity growth in 2020 was mostly an artifact of the pandemic-induced global economic slowdown.) Indeed, the 2021 BP Statistical Review of World Energy, published in June 2022, shows more than a 400 TWh jump in China’s coal-fired electricity generation, which would be the second largest year-to-year rise in the country’s history, topped only by the 2011 increase.
Moreover, reports of frightful heat waves and drought in much of China this summer almost certainly point to a slackening in hydroelectricity and a resulting upward bump in use of coal-fired power plants. At the same time, the push to electrify transportation, which is progressing much faster in China than in the United States, will spur increased use of electricity, making it harder to bend downward the curve of fossil-fuel burning to make electricity.
(Addendum from Nov 14: The new Global Carbon Budget 2022 report, prepared by an international group of some 100 climate specialists, projects that China’s carbon emissions from fossil fuel combustion will decrease by 0.9 percent in 2022 vs. 2021, as reported by the New York Times’ Brad Plumer in Carbon Dioxide Emissions Increased in 2022 as Crises Roiled Energy Markets. We’re tracking this and will update with new data.)
Other Energy Usage in China
Electricity isn’t the only form in which energy is used in China, or anywhere else, of course. Liquid fuels derived from petroleum power cars, trucks, planes and construction machinery. Natural gas and coal burned directly (rather than to make electricity) fuel industry, especially steel and cement making, and also heat homes and non-residential buildings.
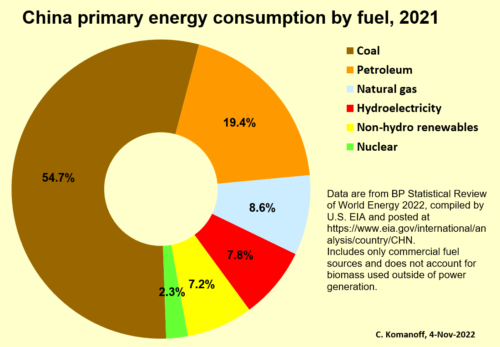 But in China, no single energy application rivals the burning of coal to produce electricity. It accounts for around one-third of the country’s primary energy consumption — a figure we computed by multiplying coal’s 55 percent share of 2021 China primary energy (see donut chart) and electricity’s estimated 60 percent share of the country’s total coal consumption (per the U.S. Energy Information Administration’s extensive write-up of China’s energy sector, which we referenced earlier).
In the United States, the electricity sector has functioned as the proverbial low-hanging fruit for decarbonization, literally accounting for the entire estimated 2005 to 2021 decrease of 866 million metric tons in total CO2 emissions from fuel burning. The trend in China has been diametrically opposite, with the country’s 2005-2021 rise in CO2 emissions from the burning of fossil fuels to make electricity more than four times as great as the U.S. decrease.*
(* = Derived as follows: Per EIA data cited in text, China generated 1,866 TWh of electricity from burning coal in 2005, and 4,775 TWh in 2020. The increase of 420 TWh to 2021 (from BP data cited in text) brings the latter figure to 5,195 TWh, which represents a rise from 2005 of 3,329 TWh. We apply the U.S. average of 2.22 lb per kWh from burning coal and raise that by 10% to reflect presumed inefficiencies in China’s coal-fired power sector and also allow a margin to reflect the small but non-zero amount of natural gas-burning to make electricity. Converting to metrics, the calculation is 3,329 x 10^9 x*2.22*1.1 / 2205, yielding a 2005-2021 increase of 3,687 million tonnes of CO2.)
Addendum, Nov. 9
We didn’t see it till today, when it hit the print edition, but on Nov. 3 the NY Times ran a long, sobering piece, China Is Burning More Coal, a Growing Climate Challenge.
Timed to the start of COP27, the story noted that China’s greenhouse gas emissions grew in 2021 at their fastest pace in a decade, though that was partly an artifact of the slow increase in pandemic 2020. A more startling factoid was that China’s carbon emissions just from burning coal now exceed total energy-related U.S. emissions — a statistic we confirmed by looking up U.S. 2021 energy-related CO2 emissions in our carbon-tax model, 5,289 million metric tons, and computing China’s 2021 CO2 emissions from burning coal to make electricity; coincidentally, they were the same: 5,289 million metric tons.
Though the the story’s subhead said that “Beijing is looking for alternatives,” it presented little if any evidence. Particularly unsettling was the revelation that in contrast to the U.S., where peaking power for the hundred or so highest-demand hours each year comes from quick-start gas-fired generators, China services peak usage with old coal-fired generators that can’t rapidly ramp up and down, which leads to running those plants for thousands of hours a year. Only now is China supposedly retrofitting those plants for more flexible use and, more importantly, beginning to price peak power at premiums that could incentivize customers to install on-site solar to meet peak demand.
Though the Times story includes the obligatory nod to fast-growing wind and solar in China, our second chart, above, makes clear that their growth hasn’t been nearly fast enough to enable a cap on coal-fired power. As we noted, from 2015 through 2020 the growth in coal-fired electricity generation in China was twice that of wind and solar combined. The story’s overall picture is that the planet’s carbon behemoth is not yet intent on backing away from coal.

 No federal legislation with a price on carbon has advanced to a floor vote since the “Waxman-Markey”
  Whitehouse sees his bill as a way to use U.S. trade policy to drive climate action. He also views its potential to boost U.S. industrial competitiveness as a way to attract bipartisan support. Holcim U.S., whose parent company, Lafarge Holcim, is America’s largest cement manufacturer,
 Promising developments like
 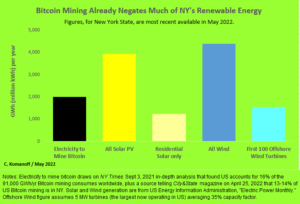 While New Yorkers are accustomed to thinking of our state as resource-poor, crypto miners are now exploiting half-a-dozen hydro power sites and formerly boarded-up fossil-fuel plants in northern and western New York. One industry source
  This isn’t to hold out carbon taxing as a one-bullet crypto killer — we need many bullets for that, the bigger the better — but to illustrate its broad potential to stop frivolous (and in this case imbecilic) new uses of electricity before they can gain a foothold.


