This page reports on carbon taxes that have been enacted (and in one case, enacted and withdrawn) in:
Canada has its own page, where we summarize its nationwide carbon price and also report in detail on British Columbia’s carbon tax, the Western Hemisphere’s (if not the world’s) most comprehensive and transparent carbon tax.
European Union: Emissions Trading System
The European Union (EU) implemented a carbon cap-and-trade system in 2005. The EU Emissions Trading System (ETS) is the world’s first international emissions trading system, operating in all EU member countries plus Iceland, Norway, and Liechtenstein.
The EU ETS covers over 10,000 stationary emitters — mostly power stations and industrial plants. It also covers domestic and intra-EU air travel. In toto, the ETS covers around 40 percent of the EU’s greenhouse gas (GHG) emissions, making it the largest carbon cap-and-trade program in the world, covering approximately 1.5 billion metric tons of CO2 per year.
For much of its existence, the ETS was largely ineffectual because its emissions caps were too high and granted large numbers of free allowances to big polluters. Concern about carbon leakage — polluters from the EU potentially going elsewhere to do their polluting, hence, “leaking” carbon from the EU — drove the EU to implement free allowances as its primary method of allocation back in 2005. As a result, polluters obtained large numbers of allowances — in 2013, manufacturers received 80% of their allowances for free — and many were able to maintain a surplus.
Compounding the problem of giveaways, the EU grossly overestimated future CO2 emissions in setting the cap amounts, resulting in a too-high number of allowances. In the first phase of the EU ETS, from 2005-2007, only three member states had caps lower than baseline 2005 emissions levels. And with the 2008 financial crisis driving emissions down, the caps were rendered even more useless.
Background
In December 2019, the European Commission — the executive branch of the EU — introduced the European Green Deal, an ambitious climate policy package with the general goal of at least 50% GHG emissions reductions by 2030 and carbon neutrality by 2050. The European Green Deal represents the EU’s main legislative effort to meet its commitments under the Paris Climate Agreement. The Green Deal included the ETS as an integral part of its action plan.
In 2020, the EU expanded to a 55% reduction its commitment to reduce emissions 40% from 1990 levels by 2030 and. The ramp-up came in December 2020, following all-night negotations in which the EU committed to helping coal-heavy countries like Poland meet individual-country commitments.
The U.K.’s concurrent exit from the EU and ETS caused a substantial exit of low-carbon power producers, resulting in an increase in average carbon contents for the remaining EU power producers. It’s not yet clear how these changes will play out, as the U.K. has not announced plans to link with any other carbon trading systems.
How the ETS Works
The European Trading System implements an emissions cap for the overall volume of GHG that may be emitted by covered airlines, power plants and factories. Emitting companies purchase at auction — or receive — tradable allowances, the total number of which is capped at a level that steadily decreases each year. Since 2013, the emissions cap has applied to the EU as a whole, not individual countries. The current cap for 2021 on GHG emissions from these stationary installations is 1.57 billion tonnes per year, or roughly half of 2019 CO2 emissions for the entire European Union, including the U.K.
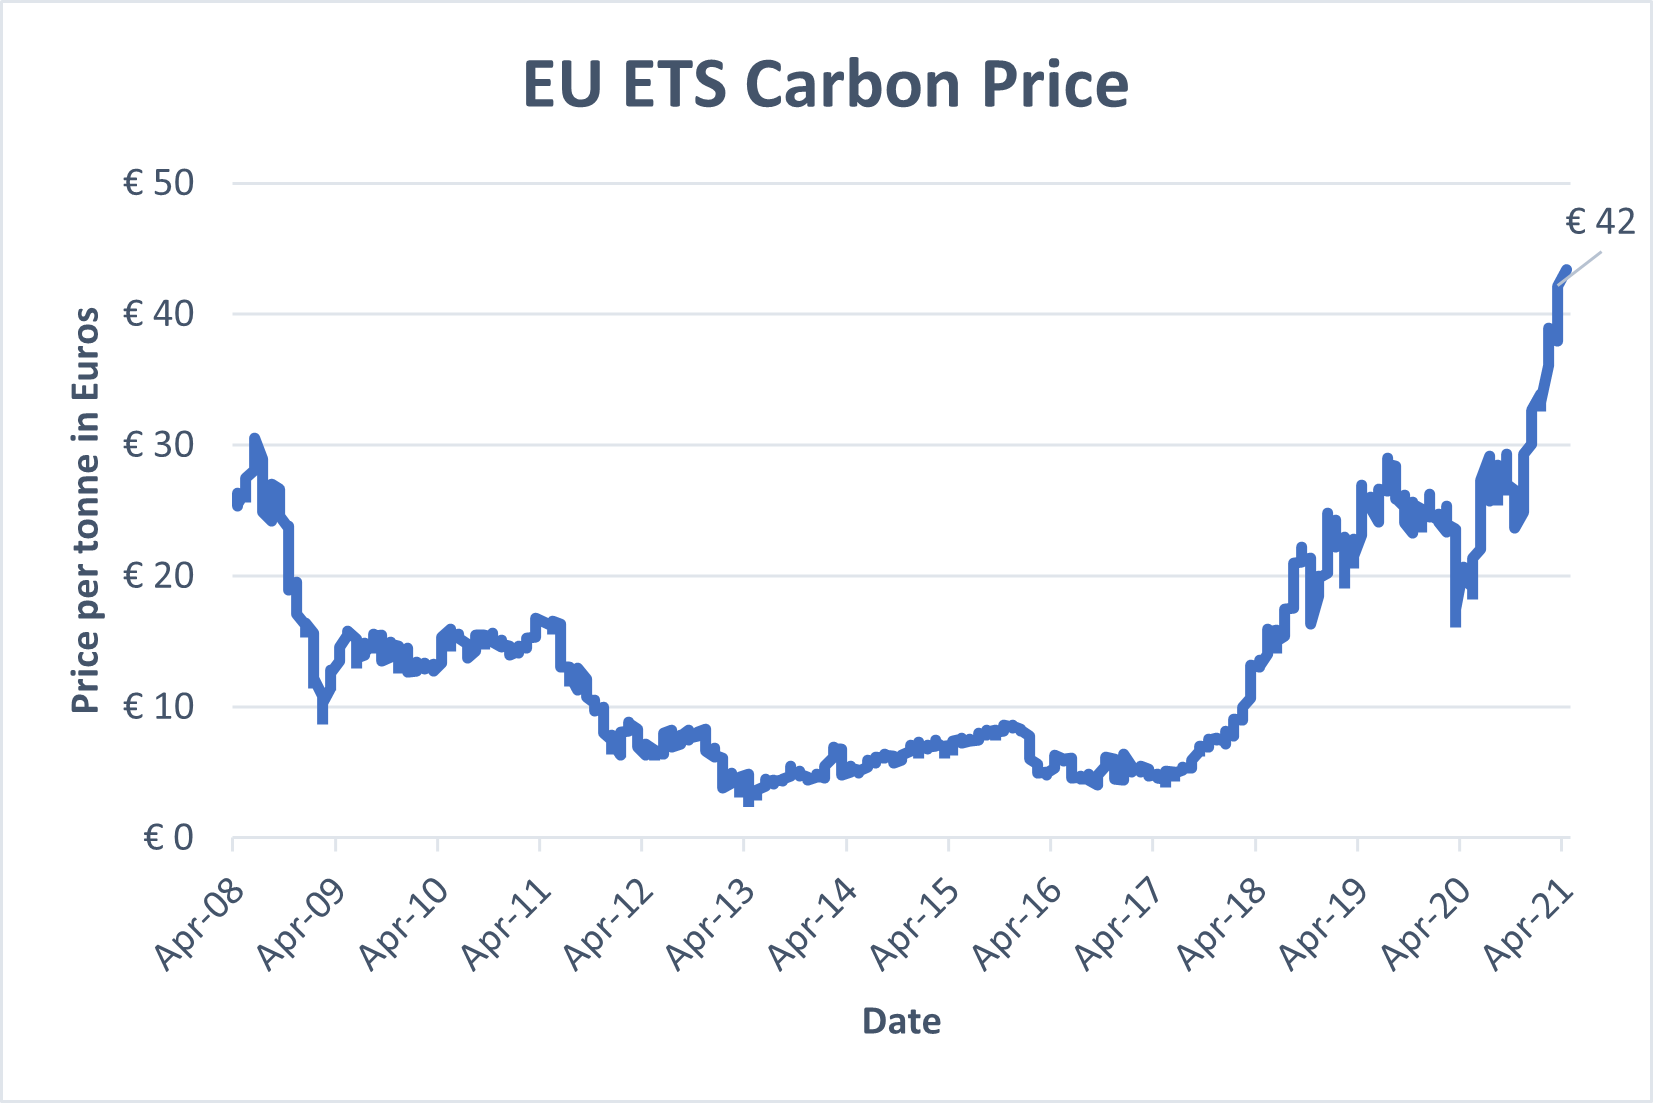
Data from https://ember-climate.org/data/carbon-price-viewer/
The price of a carbon allowance has roughly doubled in the past several years, reaching a high of nearly €43 in March 2021. BloombergNEF (New Energy Finance) projects that prices will hit €100 by 2030. The higher price levels enable the ETA to “arguably serve its purpose by making it too expensive for emitters of fossil fuels to continue business as usual,” as reported in early 2021 by Alessandro Vitelli of Montel News.
Since January 2019, the EU ETS has included a market stability reserve (MSR), which maintains any surplus of allowances, allowing for adjustments to the supply of allowances up for auction, if needed. Unallocated allowances are transferred to the reserve, which is operated under strict rules that bar meddling by the Commission or Member States.
Phases
The ETS’s 15-year tenure to 2020 may be divided into three phases.
- Phase 1, from 2005-2007, served as a pilot of “learning by doing.” During that phase, about 12,000 installations received permits to emit about 2.2 billion tons of CO2, nearly half of EU CO2 emissions at that time. Most allowances were given for free.
- In Phase 2, 2008-2012, the cap on allowances was reduced by 6.5% compared to 2005. Phase 2 aligned with the first commitment period of the Kyoto Protocol, when countries in the EU ETS had to fulfill commitments to reduce emissions by an average of 5% below 1990 levels. (The EU and its member countries ended up cutting emissions by 8% below 1990 levels.) Several countries held auctions.
- Phase 3, 2013-present, saw the application of a single, EU-wide cap on emissions instead of the previous system of national caps. Auctioning replaced free allocation as the default method of allowance allocation. Phase 3 also brought more sectors and gases under the EU ETS umbrella. During this phase, the EU-wide cap on stationary installations decreased by 1.74% each year.
For Phase 4, from 2021-2030, the Commission revised and strengthened the EU ETS in 2018. The overall number of emission allowances will now decrease at an annual rate of 2.2%, instead of 1.74%. However, significant amounts of free allowances remain, ostensibly to combat carbon leakage. The EU will still give 100% free allocation to sectors at the highest risk of relocating production outside the EU. For industries less likely to flee, free allocation will be phased out, from a maximum of 30% in 2026 to zero by 2030. Overall, the EU predicts 6 billion free allowances will be granted from 2021-2030.
Impact
The EU ETS’s specific targets are to reduce GHG emissions by 21% between 2005 and 2020, and by 43% by 2030.
Total EU emissions of greenhouse gases fell by 23 percent from 1990 to 2018, according to the European Commission. Emissions from ETS sectors alone fell 33% from 2005-2019.
Carbon leakage
In its Green Deal statement, the European Commission addressed the concern that countries across the world will continue to have “differences in levels of ambition,” by pledging to propose a carbon border adjustment mechanism as an alternative to the ETS’s carbon-leakage measures. As Inside Climate News explains carbon border adjustments:
Economists have long suggested that there’s a way to break that global impasse [on climate action] — and that’s to treat carbon like any other international trade dispute. Impose tariffs or quotas on imports from countries that have given their manufacturers an unfair advantage of uncontrolled carbon emissions.
In March 2021, the European Parliament adopted a resolution favoring a carbon border adjustment mechanism. The European Commission will propose legislation in June 2021.
United Kingdom
The United Kingdom — England, Scotland, Wales and Northern Ireland — has maintained a carbon tax since 2013. Technically, the tax is a “carbon price floor” (CPF) that functions as the minimum price that fossil fuel producers pay for emitting CO2. The CPF applies to energy-intensive industries only and is not economy-wide.
There have been several calls lately to tax carbon emissions in the U.K. at a higher rate and on a broader scale. Grantham Institute researchers Josh Burke and Esin Serin argued in a fascinating Feb. 2021 opinion piece that carbon pricing should be enacted not as a stand-alone but “as part of a significant and broad package of post-COVID fiscal reforms.”
History
As a result of the 2008 Climate Change Act — passed with overwhelming support across parties — the U.K. was required to drastically reduce its carbon output according to five-year carbon budgets. Unsurprisingly, the U.K. — birthplace of classical economics and home base of Sir Nicholas Stern, the renowned economist who in 2007 famously called climate change “the result of the greatest market failure the world has seen” — turned to carbon pricing to carry part of the load.
In 2009, the Department of Energy and Climate Change released a report, “Carbon Valuation in UK Policy Appraisal: A Revised Approach,” detailing reasons to adopt a carbon price. Witnesses at the 2009-2010 Environmental Audit Committee’s report on Carbon Budgets called for a carbon price floor, but the Labour government opposed the idea. Then in 2010, the Coalition government consulted on proposals for a CPF, and the measure was introduced in the 2011 Budget for implementation in 2013. The 2011 Budget framed the CPF as a way to “drive investment in the low-carbon power sector” and “support the long-term stability of the public finances.” The government also said the CPF “achieves the right balance between encouraging investment without undermining the competitiveness of UK industry.”
When the carbon floor was introduced, the Confederation of British Industry and Renewables Energy Association were supportive, but the measure also found criticism from several sides that argued it was, by turns, ineffective, expensive, and uncertain for investors. But the government framed the tax as the best move for consumers, stating that the “market-based approach to pricing carbon provides the most efficient and cost-effective policy framework to meet our environmental goals.”
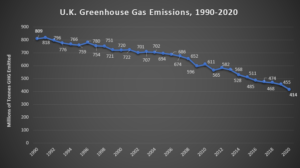
Data from U.K. Gov’t Energy Trends. Data exclude international aviation, shipping and emissions in producing imported goods.
Less than 10 years after implementing the CPF, the U.K. is halfway to meeting its goal of net zero greenhouse gas emissions by 2050. U.K. GHG emissions in 2020 were 51% below 1990 levels, putting the country mathematically on track to reach net zero by 2050.
30 Years of Falling Emissions
The first graph makes clear that this 2020 milestone is only slightly due to the COVID-19 pandemic. The 2020 decline in emissions, though severe, roughly 40 million tonnes, was no greater than that in 2014 (also 40 million tonnes) and was less than the 56 million tonne drop in 2009, during the severe recession. Emissions fell in almost every year from 1990.
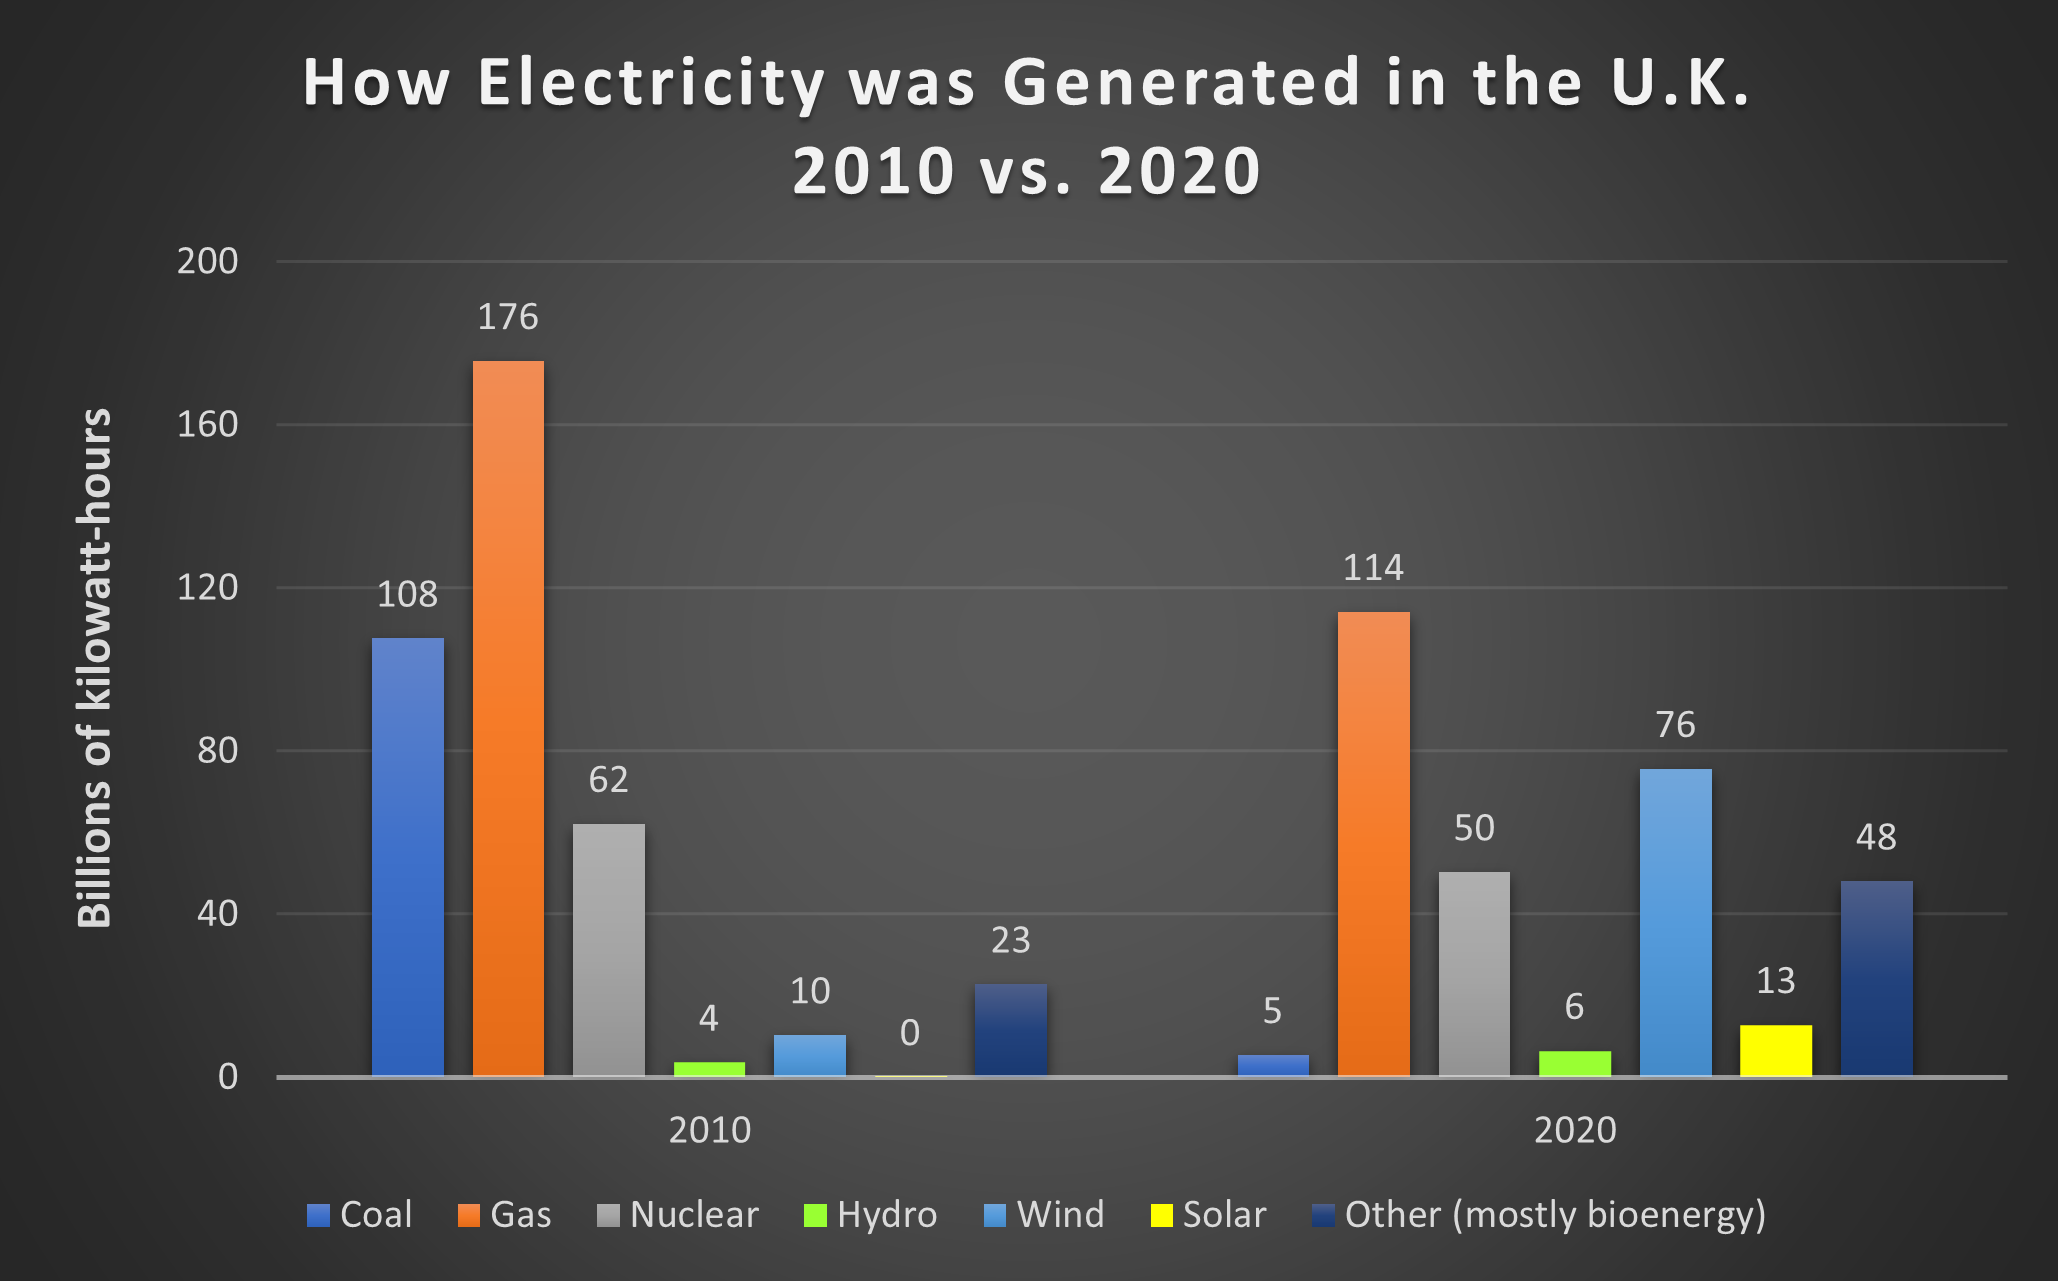
Data from Department for Business, Energy & Industrial Strategy: Dataset for quarterly and monthly supply and consumption of electricity, Table 5.1.
The anticipated recovery from COVID-19 will, of course, provoke a partial rebound in emissions. The national government’s March 2021 Industrial Decarbonisation Strategy specifies that industrial emissions must fall by two-thirds before 2035 to enable the U.K. to meet its Dec. 2019 pledge — the first by a major economy in the world — to reach net-zero GHG emissions by 2050.
What accounts for the huge drop in U.K. greenhouse gas emissions from 1990 to 2019? Carbon Brief credits three changes for around 90% of the decline:
- Electricity that doesn’t rely on coal – 43% of electricity was generated by renewables in 2020 (“renewables” does not include nuclear power, but it does include wind, hydro, solar, and bioenergy).
- Cleaner industry and a shift away from carbon-intensive manufacturing.
- A pared-down, cleaner fossil fuel supply industry.
It’s important to note, however, that a considerable amount of U.K. “renewable” electricity is generated by burning biomass, i.e. wood pellets. Inclusion of bioenergy as a renewable source of energy is at best contentious and more likely a scam, as journalist Michael Grunwald pointed out in his March, 2019 expose in Politico.
U.K. Carbon Pricing: Details
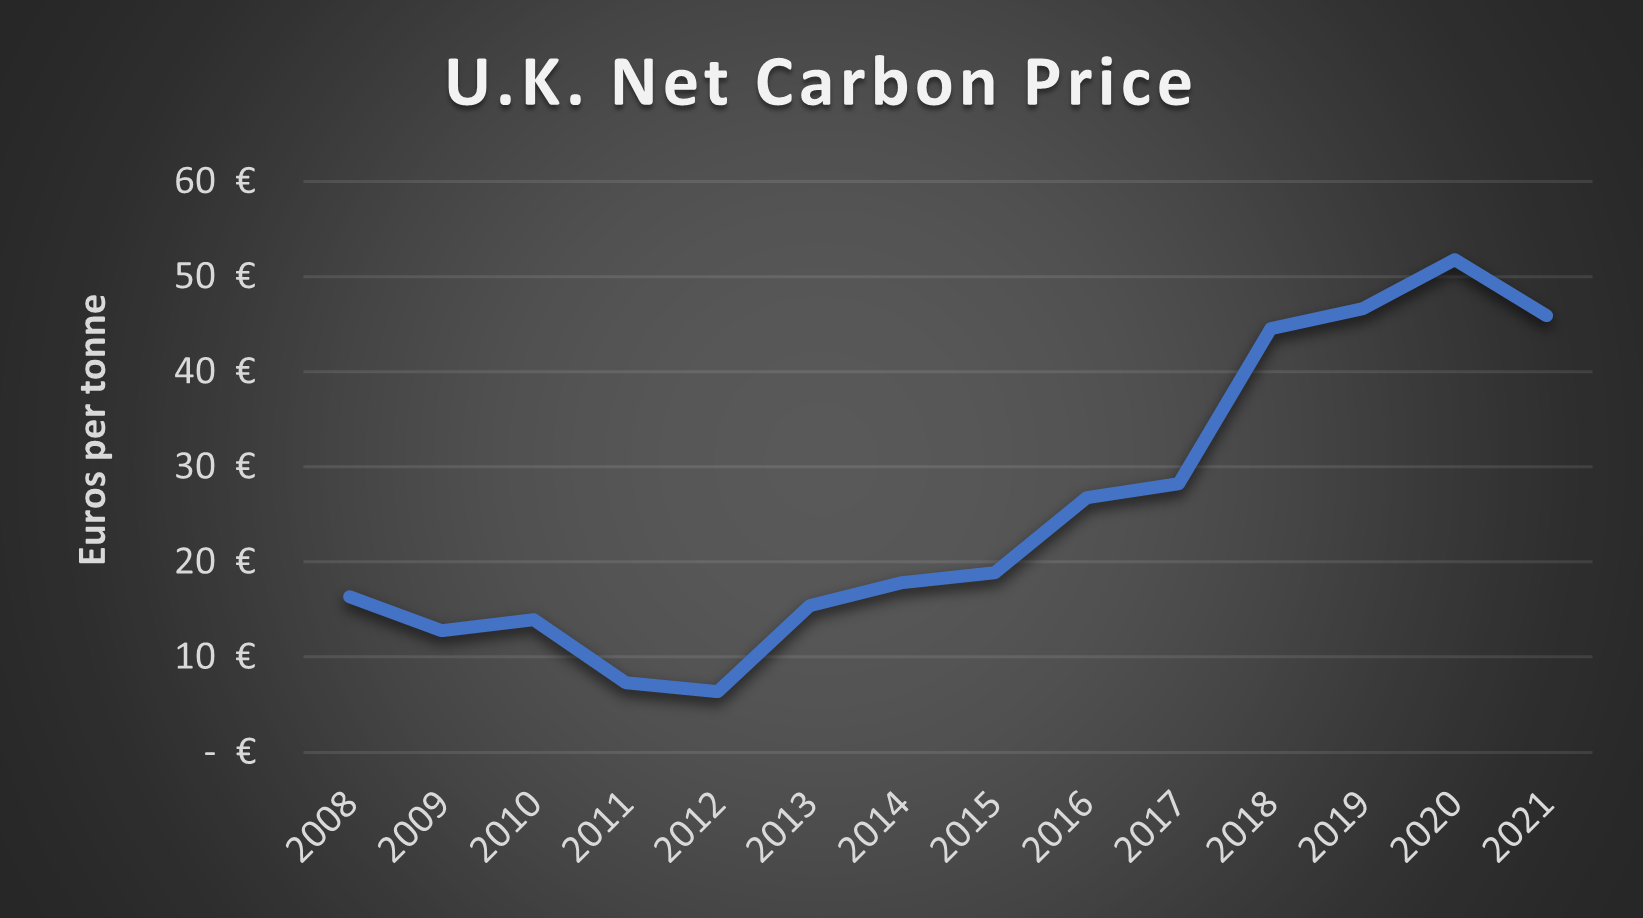
Data from https://ember-climate.org/data/carbon-price-viewer/ and https://commonslibrary.parliament.uk/research-briefings/sn05927/
Initially priced at £16/tonne in 2013, the U.K.’s carbon price floor (CPF) was set to increase to every year, hitting £30/tonne by 2020 and £70/tonne in 2030, but was capped in 2015 at £18.08/tonne until 2021 (20.40 euros at the 2015 exchange rate). The CPF has impacted the generation fuel mix significantly; coals share fell from 41% in 2013 to less than 8% in 2017.
Brits sometimes call their CPF a “top up” tax since it was intended to top up European carbon pricing in the form of the EU emissions trading scheme (ETS). The U.K. finished its Brexit transition from the EU at the end of 2020, creating the need for a new, non-EU emissions trading scheme (ETS).
The U.K. announced in February 2021 that it would launch its own carbon trading scheme in May 2021. The U.K. government says their ETS replaced the UK’s participation in the EU ETS as of January 1, 2021, but the first U.K. ETS emissions auctions will not begin until May 19, 2021.
According to Auctioning Regulations released in February, bids will follow a minimum Auction Reserve Price (ARP) of £22/tonne when they begin in May, but the price will increase: “The government will consult on its intent to withdraw the ARP as part of the planned consultation to appropriately align the U.K. ETS cap with a net zero trajectory which will be launched later this year.”
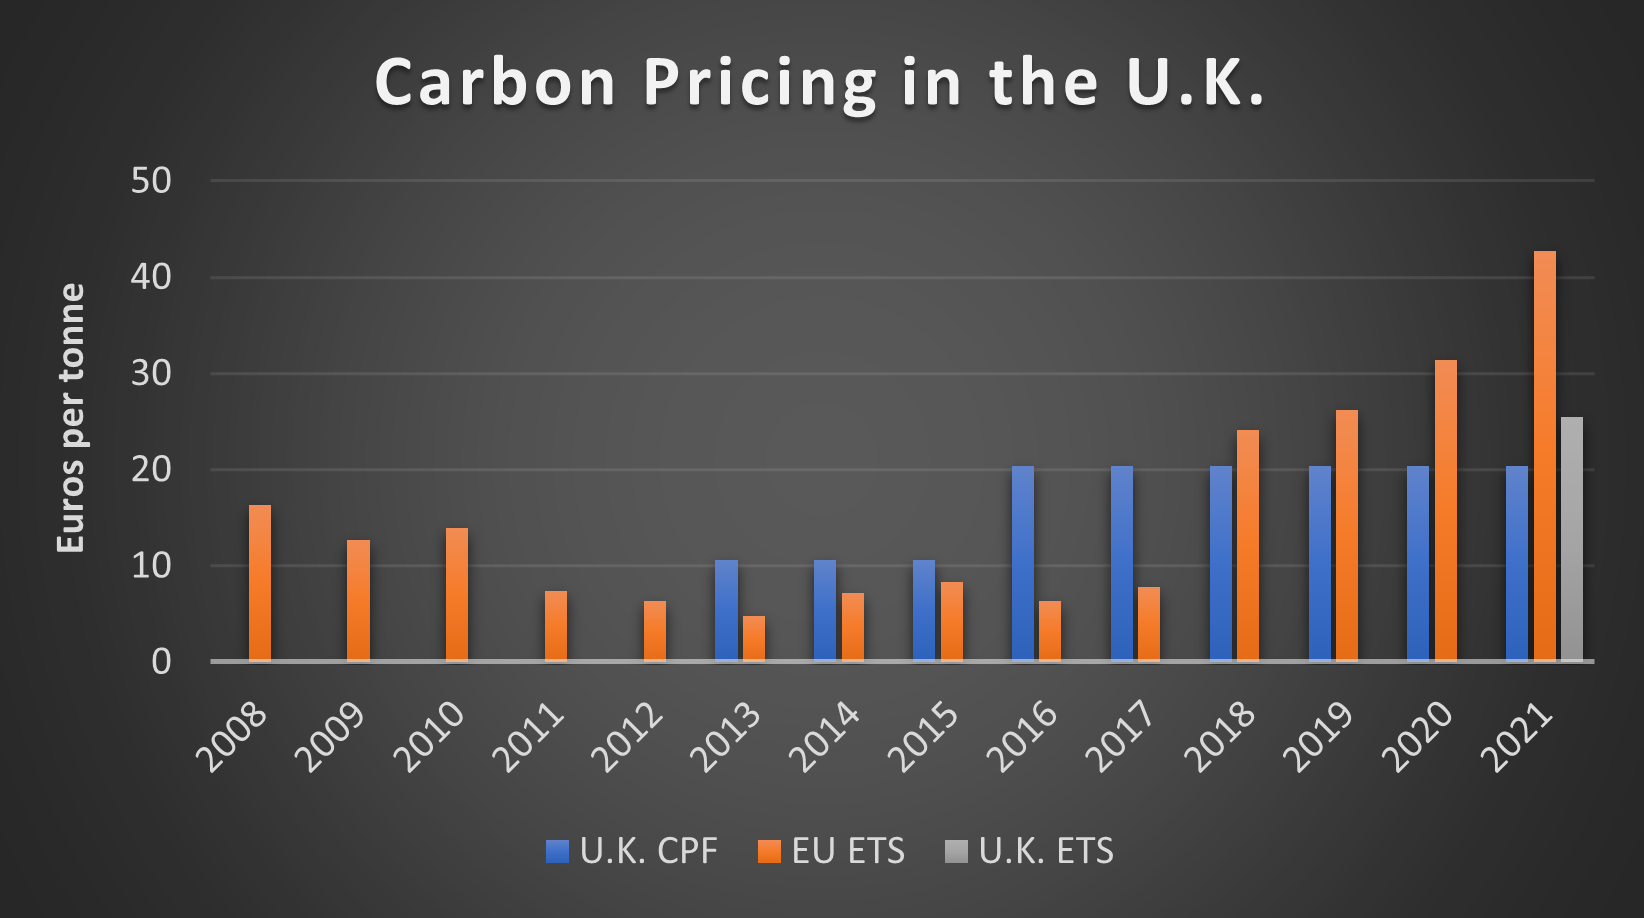
Data from https://ember-climate.org/data/carbon-price-viewer/ and https://commonslibrary.parliament.uk/research-briefings/sn05927/
The floor for the U.K. ETS was initially set to 15 pounds but raised to 22 pounds per tonne, perhaps following some form of the logic suggested by climate advocacy group Ember: “The EU ETS has averaged a price of around £22/t (€25/t) over the last two years, so it would make sense to set the U.K. carbon price floor to at least that level, especially with further reform to strengthen the EU ETS price due in the coming year.”
The U.K. government stated in the Autumn Budget 2017 that they were “confident that the Total Carbon Price, currently created by the combination of the EU Emissions Trading System [of 7.78] and the Carbon Price Support [of 20.40], is set at the right level, and will continue to target a similar total carbon price until unabated coal is no longer used.”
Ireland
(Thanks to Wesleyan University environmental studies major Nicholas J. Murphy for expanding this section in July 2015.)
Ireland enacted a carbon tax in 2010 under a coalition government of its Green Party, Fianna Fáil (one of Ireland’s two mainstay center-right parties) and the Progressive Democrats. Originally designed to provide a double dividend by offsetting income taxes, the revenue was re-allocated to satisfy the diktats of the Troika — the triumvirate of the European Commission (EC), International Monetary Fund (IMF) and European Central Bank (ECB) that administered the austerity policies on EU member nations bailed out during the 2008 debt crisis. (See OECD working paper on Ireland’s Carbon Tax and the Fiscal Crisis.)
The effect is arguably similar, since income taxes would have had to rise, absent the carbon tax revenues. Frank Convery, an economist at University College Dublin considered the foremost expert on Ireland’s carbon tax, writes enthusiastically:
Ireland is a pioneer in the implementation of a carbon tax. This has allowed us to avoid (more) increases in income tax which would have further reduced disposable income, increased labour costs and destroyed jobs. It is also facilitating us in meeting our very demanding legally binding obligations to reduce greenhouse gas emissions, and provides support for the creation of new jobs in improving energy efficiency and growing the low carbon economy.
Ireland’s carbon tax covers nearly all of the fossil fuels used by homes, offices, vehicles and farms, based on each fuel’s CO2 emissions. It began in 2010 at €15/ton and rose to €20/ton in 2012, where it remains today. Solid fuels (coal and peat) were added in 2013 at €10/ton after concerns from agricultural interests were resolved, and that price has since risen to match the €20 price on other fuels. The tax generates roughly €100 million in revenue per €5 of tax, meaning it currently draws about €400 million annually.
The carbon tax has been complemented by other environmental taxes based on vehicle fuel efficiency and domestic landfill waste, as New York Times environmental correspondent Elisabeth Rosenthal reported in Dec. 2012, in Carbon Taxes Make Ireland Even Greener:
Over the last three years, with its economy in tatters, Ireland embraced a novel strategy to help reduce its staggering deficit: charging households and businesses for the environmental damage they cause. The government imposed taxes on most of the fossil fuels used by homes, offices, vehicles and farms, based on each fuel’s carbon dioxide emissions, a move that immediately drove up prices for oil, natural gas and kerosene.
Household trash is weighed at the curb, and residents are billed for anything that is not being recycled. The Irish now pay purchase taxes on new cars and yearly registration fees that rise steeply in proportion to the vehicle’s emissions.
Environmentally and economically, the new taxes have delivered results. Long one of Europe’s highest per-capita producers of greenhouse gases, with levels nearing those of the United States, Ireland has seen its emissions drop more than 15 percent since 2008. Although much of that decline can be attributed to a recession, changes in behavior also played a major role, experts say, noting that the country’s emissions dropped 6.7 percent in 2011 even as the economy grew slightly.
Notably, the Irish carbon tax was designed to fill gaps left by the European Union Emissions Trading Scheme (EU ETS), which addresses only large polluting firms and accounts for only roughly 40% of emissions sources while being hampered by volatility. The case of Ireland demonstrates the potential for EU-wide cooperation in setting an effective harmonized price on carbon in preference to a piecemeal and volatile ETS.
The elements of Ireland’s carbon tax introduced in 2010 are specified in the Finance Act of 2010. (See Part 3 (Customs and Excise), Chapters 1 (Oil), 2 (Natural Gas), and 3 (Solid Fuels) for tax rates and other provisions.)
Ireland’s Vehicle Registration Tax is also partly emissions-based. A VRT Calculator on the Irish Tax & Customs website provides a means to estimate the amount of tax on a vehicle based on Make/Model/CO2 Emissions. Interestingly, the CO2-sensitive VRT has touched off a pronounced shift to diesel vehicles, which emit less CO2 but more of other pollutants with localized health impacts. Changes to the tax rate in Budget 2013 are detailed here.
Finally, the law firm Arthur Cox offers these useful guides ([1] & [2]) to Ireland’s carbon tax.
Australia
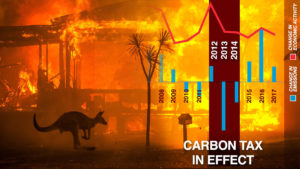
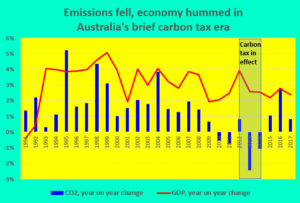
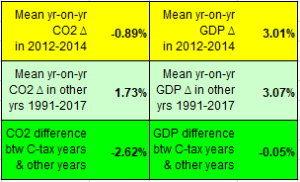
The widespread wildfires devastating much of Australia in the Southern Hemisphere’s 2019-2020 summer have drawn worldwide news coverage and cast that country’s retrograde official climate stance in appropriately harsh light. CTC’s blog post, Australia’s Brief, Shining Carbon Tax distilled and updated the information below and also revealed the stunning detail that the two years in which Australia had a national carbon tax, 2012-2014, saw dramatic drops in CO2 emissions, both absolute and relative to GDP (see graphic directly below, at left). As of this mid-January writing, however, no other media had picked up this finding.
The Liberal Party government of PM Scott Morrison has come under withering attack for hewing to the climate-denying line of the Murdoch-dominated press that alternately blames the fires on arsonists and wildland “mismanagement” while hand-wringing that unilateral action to curb Australia’s emissions would have little or no discernible impact because the country accounts for only 1 percent of global CO2. The Daily Beast has reported that James Murdoch, the media baron’s younger son, was sharply critical of Fox News and News Corp’s “climate-change denial,” while Australian union organizer James Raynes posted the ironic tweet shown at right.
Our earlier coverage of Australia carbon taxing, though somewhat dated, is below. Be sure to read our Jan. 7 (2020) post.
Australia instituted a carbon tax on July 1, 2012 and repealed it two years later, on July 17, 2014. Both events were milestones. Though some countries, notably Sweden, have had longer-standing and stronger national carbon levies, Australia’s was the first explicit national tax on carbon emissions. The repeal was also precedent-setting, and predictably it has garnered far more global attention (and hand-wringing) than did the tax itself.
The tax level, $23 per tonne (metric ton), equated to $19.60 per U.S. ton of CO2, at the U.S.-Australian dollar exchange rate (1.00/0.94) in July 2014.
As recounted by Australian journalist Julia Baird in a 2014 NY Times op-ed, A Carbon Tax’s Ignoble End: Why Tony Abbott Axed Australia’s Carbon Tax, published a week after Australia’s Senate voted for repeal, the tax was a political stepchild, opposed by the country’s two major political parties, left-leaning Labor and center-right Liberal, and brokered by the Greens during a period of governmental stalemate in 2011-2012:
In 2010, the Labor prime minister, Julia Gillard, said she would look at carbon-pricing proposals, but also promised, “There will be no carbon tax under the government I lead.” Then, under pressure to form a minority government, she made a deal with the Greens and agreed to legislate a carbon price: a tax by any other name.
The heat, anger and vitriol directed at her as a leader — and as Australia’s first woman to be prime minister — coalesced around the promise and the tax. It grew strangely nasty: She was branded by a right-wing shockjock as “Ju-Liar,” a moniker she struggled to shake. The political cynicism surrounding the carbon tax certainly reduced Ms. Gillard’s political capital, but it was a perceived lack of conviction in the policy itself that damaged the pricing scheme’s credibility.
See also Australian ABC News’ superb Timeline of the tax’s torturous political path, posted in July 2014.
Predictably, the Times’ news dispatch, Environmentalists Decry Repeal of Australia’s Carbon Tax, cast the repeal as greens vs. economy, ignoring the reductions in carbon intensity in the power sector (which helped blunt the tax’s cost) as well as provisions that directed revenues to households to mitigate consumer impacts (see below).
Australia’s carbon tax also imposed climate-equivalent fees on methane, nitrous oxide and perfluorocarbons from aluminium smelting, and was collected from roughly 500 of the nation’s biggest emitters, according to the Big Pond Money blog. These included electricity generation, stationary energy producers, mining, business transport, waste and industrial processes; some (non-electric) industries were eligible to receive trade-exposure based assistance, according to the same source. Most if not all road transport fuel (i.e., petrol) was exempt. The tax level was indexed to inflation and rose from the initial $23.00 (Australian) per tonne to $24.15 per tonne in 2013 and $25.40 in 2014. Beginning July 1, 2015 the price was to be set by a cap-and-trade system linked to the EU ETS (whose price has fallen below $10/T CO2). PolitiFact Australia compared the size and breadth of its carbon tax with others around the world, neatly refuting the Liberal Party’s pejorative characterization of the tax as “the world’s largest.”
In May 2013, one of Australia’s major papers, the Age, reported that national electricity generation with highly polluting lignite coal had fallen 14% vs. the same year-earlier period in the tax’s inaugural nine months, with conventional coal-fired generation also falling, by nearly 5%. During the same period, renewable electric generation “soared” by 28% and electricity output from lower-carbon methane increased by 9.5%. While factors such as greater hydro-electricity availability, flooding of a major coal mine, and implementation of a 20% renewable-energy target probably contributed to the declines in coal use, the 2.4% reported drop in overall electricity generation suggests that the carbon tax played a part.
Overall, reported the Age in the same article, “the emissions intensity of the national electricity market has fallen 5.4 per cent since the carbon price was introduced [presumably over the nine months extending from July 2012 through March 2013], meaning carbon emissions from power generation is [sic] down 7.7 per cent, or 10 million tonnes, from the previous nine months.”
Similar statistics were reported earlier, in Jan. 2013, by “The Australian” newspaper. The “big change in the mix of power” was attributed to “much greater use of renewable energy from hydroelectricity from the Snowy Mountains and Tasmania, and also wind farms.” The same source also said that “The retreat of manufacturing has been a factor, with the closure of the Kurri Kurri aluminium smelter last year and cutbacks in other metals plants affecting industrial demand.” A consultant cited by The Australian added that “the spread of roof-top solar panels and of appliances that used less energy were reducing growth in household consumption” of electricity, while another consultant, pointing to reduced electricity generation and emissions, said that “changes of this scale are without precedent in the 120-year history of the electricity supply industry.”
According to “The Australian,” the power sector accounted for about half of Australia’s emissions and a larger share of the carbon tax, because some of the largest emitters have free permits.”
Use of the carbon tax revenues was complex. Some went to the Australian Renewable Energy Agency for project funding and other monies providing “a raft of other compensation and development funds focused on biodiversity, low carbon agriculture, small business grants and support for indigenous communities,” according to Big Pond Money. More than half of the revenue was said to be earmarked to support low and middle income households to cover the increase in prices that business will pass on to consumers. The government also acknowledged, according to Big Pond Money, that the carbon tax would take more from 3 million households than it would return, while 2 million households would be no worse off and 4 million households better off. A Household Assistance Estimator developed by the authorities was said to provide a means for families to estimate how they would fare financially under the carbon tax.
A later AP story hammered Australia’s carbon tax, asserting that “Voters have never stopped hating the tax and its effect on their electric bills” and predicting that it would doom the ruling Labor Party in the Sept. 8, 2013 elections. “Longtime Labor Party supporters — even people who have helped cut pollution by installing solar panels at home — have flocked to the opposition,” AP reported, in Australian Gov’t Faces Carbon Tax Backlash at Poll (Sept. 6, 2013). “The government estimated the tax would cost the average person less than AU$10 per week,” said AP, “but three months after it took effect, most Australians surveyed by policy think-tank Per Capita said it was costing them more than twice that much. But they also expressed confusion, with most blaming the tax for higher gas prices even though it is not levied on motor fuel purchases.” In an e-mail, cap-and-dividend proponent Peter Barnes blamed the tax’s unpopularity on the absence of “100% dividends, fully transparent and highly visible.” We don’t disagree.
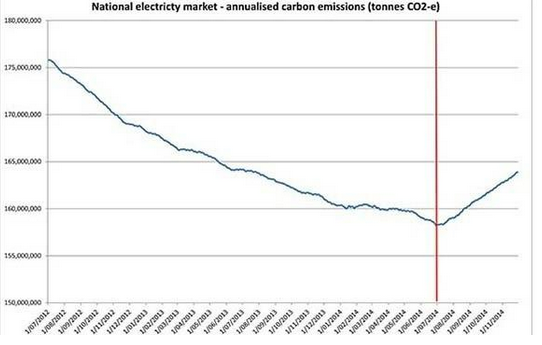
Update (January 2015): In case anyone doubted the effectiveness of taxing carbon pollution, the following graph of power plant CO2 emissions published in Australia’s Guardian shows what has happened in the year since the tax was repealed. The vertical red line is the repeal date.
See also, Emissions for power sector jump as carbon tax ends (Sydney Morning Herald, 1/7/15).
Chile
In October 2014, Chile enacted the first climate pollution tax in South America. It’s a modest levy — a mere $5 per metric ton of CO2 — that applies to only 55% of emissions. Moreover, it doesn’t take effect until 2018. Still, it’s a positive first step. The NY Times reported these details:
Chile’s tax, which targets large factories and the electricity sector, will cover about 55 percent of the nation’s carbon emissions, according to Juan-Pablo Montero, a professor of economics at the Pontifical Catholic University of Chile, who informally advised the government in favor of the tax. At $5 per metric ton of carbon dioxide emitted, Chile’s tax is lower than the $8-per-metric-ton carbon price in the European Union’s carbon-trading system, which has often been criticized as too lax. But it is higher than a carbon tax introduced in Mexico in January.
“We all understand we need to go way beyond the $5 mark” in order to really reduce carbon emissions, Dr. Montero said. However, he added, “I think this still allows you to start building the institutions that you need in the future, when you start moving forward toward more ambitious goals.”
Chile’s tax was enacted as part of a broader tax reform and revenue measure, according to the Times:
Chile’s approval of a carbon tax owes much to its positioning inside a broader tax package, experts said. At the same time that it passed the carbon tax, the Chilean government raised corporate taxes substantially, in a bid to increase revenues for education and other projects. As a result, the carbon tax raised less debate within Chile than it might have otherwise, though electricity companies have objected.
Sweden
Sweden enacted a tax on carbon emissions in 1991. Currently, the tax is $150/T CO2, but no tax is applied to fuels used for electricity generation, and industries are required to pay only 50% of the tax (Johansson 2000). However, non-industrial consumers pay a separate tax on electricity. Fuels from renewable sources such as ethanol, methane, biofuels, peat, and waste are exempted (Osborn). As a result the tax led to heavy expansion of the use of biomass for heating and industry. The Swedish Ministry of Environment forecasted in 1997 that by 2000 the tax policy would have reduced CO2emissions in 2000 by 20 to 25% more than a conventional, regulatory-based policy package (Johansson 2000). On September 17, 2007, Sweden’s government announced that it will increase its carbon taxes to address climate change. Petrol prices will go up 17 öre per litre, with the increase in fuel tax calculated on the basis of a 6 öre tax increase per kilo of CO2 emitted. (The Local)
A new (July 2014) major report by the International Monetary Fund, “Getting Energy Prices Right,” briefly summarized Sweden’s carbon-fuels tax regime as follows:
In the early 1990s, Sweden introduced taxes on oil and natural gas to charge for carbon and (for oil) sulfur dioxide and on coal-related sulfur dioxide and industrial nitrogen oxide emissions. These reforms were part of a broader tax-shifting operation that also strengthened the value-added taxes while reducing taxes on labor and traditional energy taxes (on motor fuels and other oil products). (See Box 3.5, “Environmental Tax Shifting in Practice,” p. 41. The full report is behind a paywall and may be ordered via this link; Chapter 1 of the report, a summary, may be downloaded at no charge via this link.)
Sweden’s carbon tax history and current status were summarized intelligently in a 2013 blog post by “realmelo,” who appears to be a graduate student in economics in British Columbia. Click here for her/his useful, brief report.
Other Nations
(Note: See comment at bottom of page on the Vermont University Law School book, The Reality Of Carbon Taxes In The 21st Century.)
France has no carbon price outside of the implicit price from its participation in the European Union’s Emission Trading System. In April 2016, however, Ségolène Royal, Minister of Environment, Energy and the Sea, issued a four-page declaration calling for the nations of Europe to adopt “a carbon component in the energy tax” of €22/tonne in 2016, with a price trajectory of €56/tonne in 2020 and €100/tonne in 2030. Converting from euros (at the 1.14 exchange rate of 4-April-2016) and metric tons, the price schedule equates to $23/ton today, $58/ton in 2020 and $103/ton in 2030. She wrote:
This measure is essential to encourage energy efficiency and the development of renewable energy in the transport and construction sectors, which have the largest potential for investment and job creation. This change can be made by revising directive 2003/96/CE restructuring the communal taxation framework for energy products and electricity, which has remained unchanged for several years. It may also be undertaken by Member States individually. It should also be based on the principle of fiscal neutrality to avoid increasing mandatory contributions and instead favour the transfer of taxation to fossil fuels. The context is favourable because the drop in the price of hydrocarbons and gas is significant enough so that the carbon component will not result in increasing the final bill including all taxes for consumers (including motorists). Thus, the introduction of the carbon component preserves purchasing power over the short term, but gives a clear signal of the need to quickly carry out energy retrofitting on housing, purchase clean vehicles and develop renewable energy (especially renewable heat and biogas).
Minister Royal’s statement also urged EU member states to “work for the establishment of the carbon price outside the European Union and unite countries that choose to act.”
The goal is not to impose a single worldwide price or a world CO2 market, but to bring together all committed countries and companies around common principles: ensure the carbon price is within the range of between $10-20/tonne before 2020 and $30-80/tonne in 2030; remove subsidies for fossil fuels; prepare for price convergence through networked carbon markets or mechanisms for rebalancing competition such as carbon inclusion mechanisms. The alliance may rely on the Carbon Pricing Leadership Coalition, on condition that it follows its road map and expands it to new countries.
Finland enacted a carbon tax in 1990, the first country to do so. While originally based only on carbon content, it was subsequently changed to a combination carbon/energy tax (U.S. EPA National Center for Environmental Economics). The current tax is €18.05 per tonne of CO2 (€66.2 per tonne of carbon) or $24.39 per tonne of CO2 ($89.39 per tonne of carbon) in U.S. dollars (using the August 17, 2007 exchange rate of USD 1.00= Euro 0.7405). Current taxes are summarized in a Ministry of the Environment fact sheet Environmentally Related Energy Taxation in Finland.
New Zealand made plans in 2005 to enact a carbon tax equivalent to $10.67 (of U.S.) per ton of carbon (based on conversion rate of USD 1.00 = NZD 0.71). The tax would have been revenue-neutral, with proceeds used to reduce other taxes (Hodgson 2005). However, a new government determined that the carbon tax would not cut emissions enough to justify the costs, and the tax was abandoned (Myer 2005). [CTC addendum: In Sept. 2007 the government unveiled a proposed emissions cap-and-trade scheme intended to cover all carbon emissions. The NZ Green Party’s preliminary assessment provides some details.]

